

Direct from the desk of Dane Williams.
This is a simple trade walkthrough of yesterday's Gold setup which was part of my daily market analysis shared on LeoFinance.
If you're looking for a clean and simple support/resistance trading strategy, then my blogs are perfect for you.
The Gold Higher Time Frame View
We always start with a higher time frame chart - That is the daily or above.
This is used to find the trend and support/resistance zones that are in play.
If price holds support, we look to buy. If price holds resistance, we look to sell. A simple concept that anyone can understand.
I've quoted the higher time frame Gold chart from yesterday's analysis.
XAU/USD Daily:
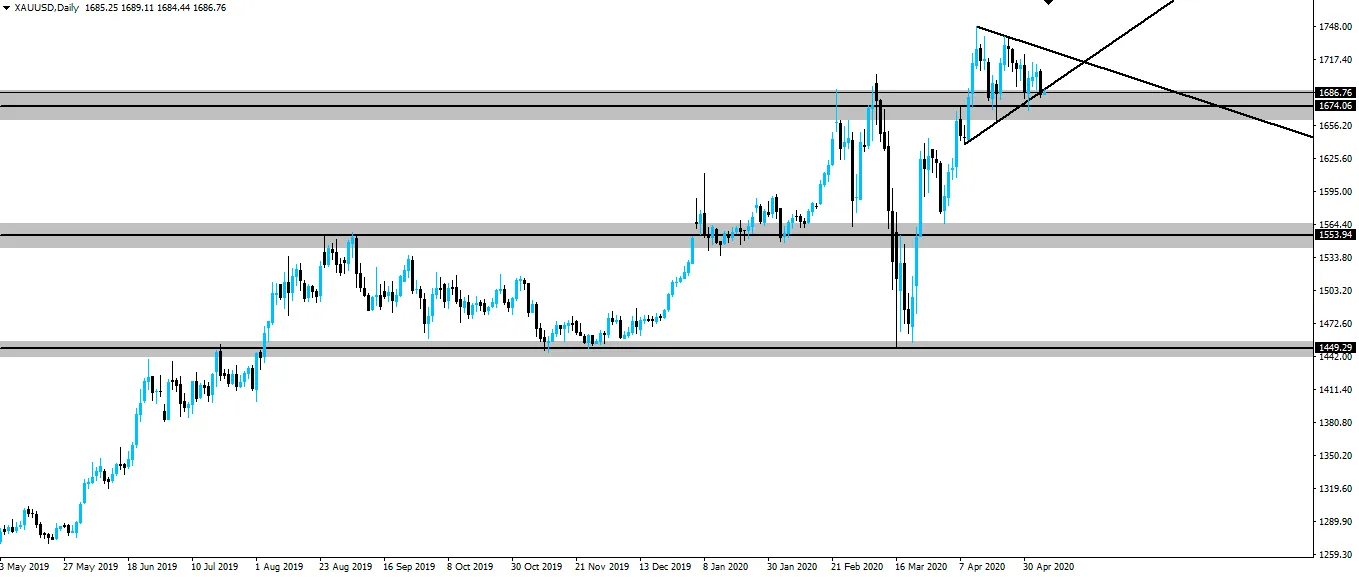
We can see that price had broken higher through an obvious resistance zone and then come back to retest it, this time as support.
With the zone now holding as support, we were looking to buy.
The Gold Intraday View
After finding a market in play and the direction we want to trade from the higher time frame zone, we then zoom into an intraday chart to refine our entries - That is usually an hourly.
When we zoom into an intraday chart, we look for areas that have acted as short term resistance and then look to buy when price retests them as support.
This keeps everything from the higher time frame chart down, all pointing in the same direction and allows us to place a much tighter stop-loss.
Here is how the setup played out on the hourly.
XAU/USD Hourly:
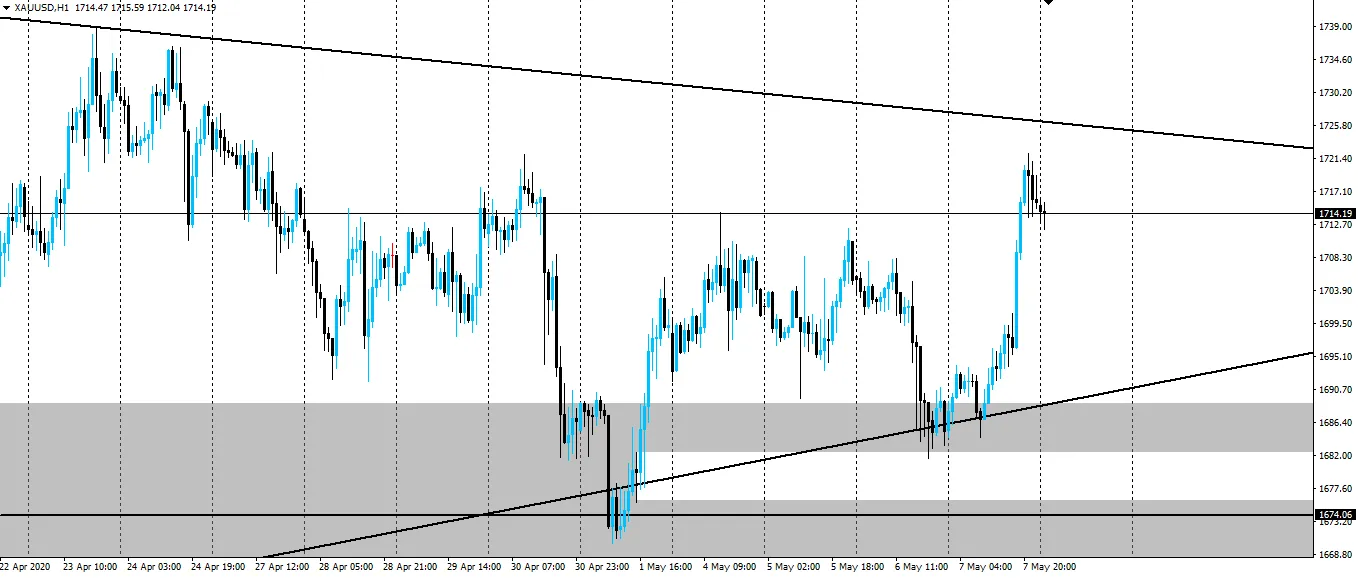
The grey box shows the higher time frame support zone drawn on the daily, while the white box is drawn from the first area of short term resistance that we could use to buy off if it was retested as support.
You can see that is what happened as price pulled back into the zone, before the bulls took control and price ripped higher.
By using intraday zones like this as trade entry signals, we're able to keep our stop-loss tight and our risk:reward high.
ForexBrokr on LeoFinance and Email
The ForexBrokr brand is a constantly evolving, long term project of mine.
I currently publish daily market analysis of higher time frame support/resistance zones here on my LeoFinance blog, as well as helping to curate the best content within the community.
From here, I will soon get back to writing intraday trade analysis such as this, exclusively on my daily forex email note.
If you find value in what I do, reach out to me either in the comments here, or on Twitter. I'm always happy to chat markets!
Best of probabilities to you,
Dane.
FOREX BROKR | Hive Blog Higher time frame market analysis.
Posted Using LeoFinance
Return from +300 Pips Trading Gold - Simple Trade Walkthrough to forexbrokr's Web3 Blog
