

Good evening guys,
I get that we’re all excited about the EOS mainnet launch and all that good stuff, but nobody is just looking at the charts!
Over the last few weeks, I’ve spoken about some key EOS daily levels on the blog and the fundamentals of the mainnet launch really haven’t changed anything from a charting perspective.
Take a look at the daily below:
EOS/USD Daily
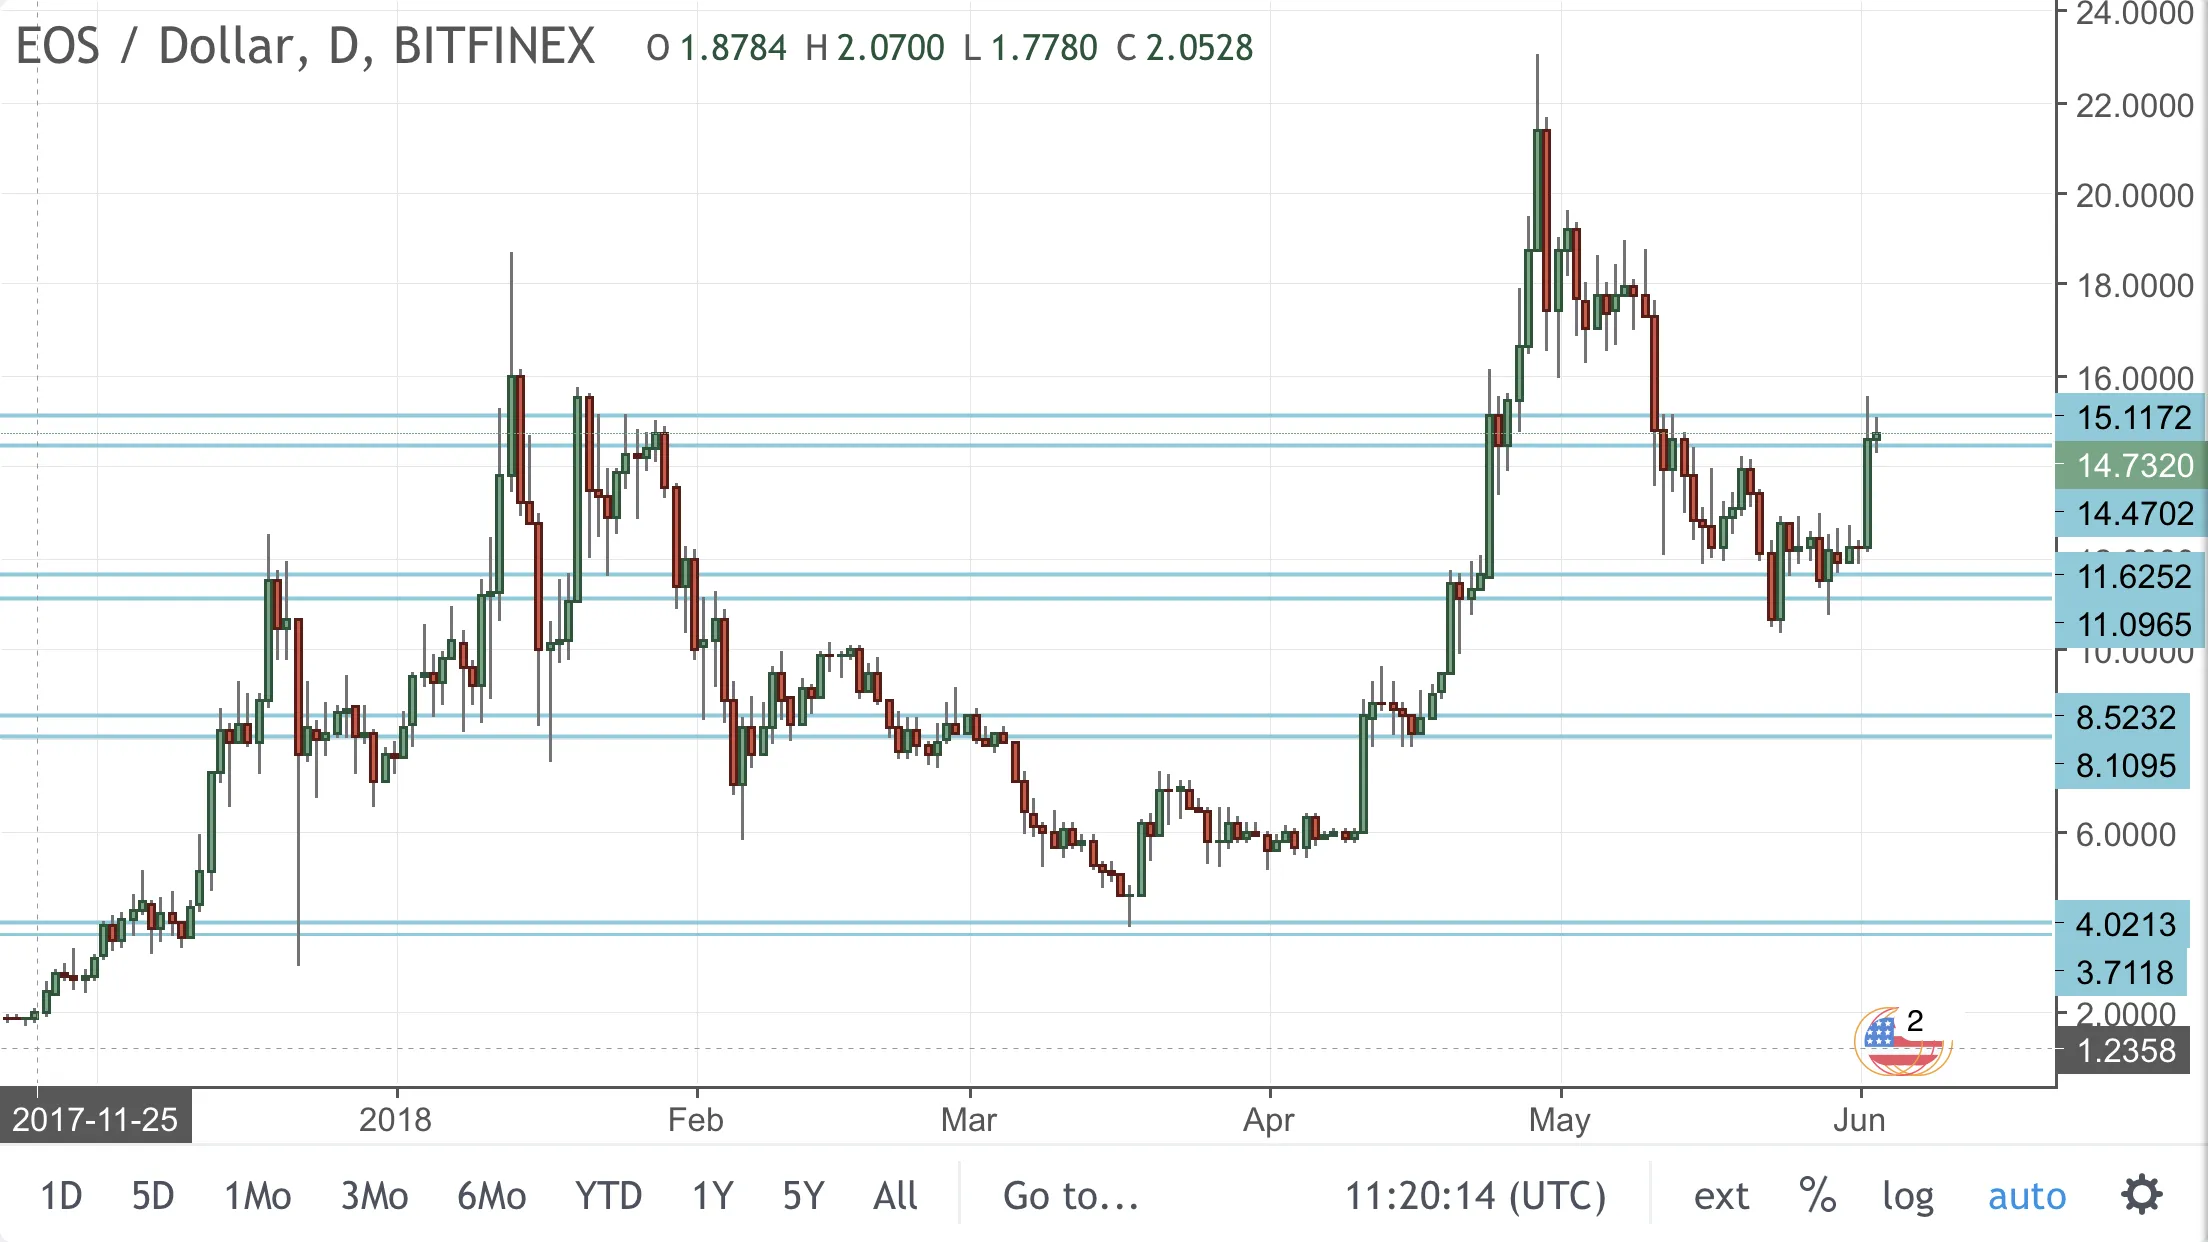
If you clicked that link above, you can see that price did bounce off that higher time frame support zone. While price was above this zone, the mainnet was successfully launched and price rallied to the next level of higher time frame resistance.
Did technicals preempt the move? Well that’s an argument for another day, but you can see the narrative unfold in front of your eyes on this blog.
So now with price hitting the next higher time frame level of resistance, zoom into an intraday chart and watch the price action:
EOS/USD Hourly
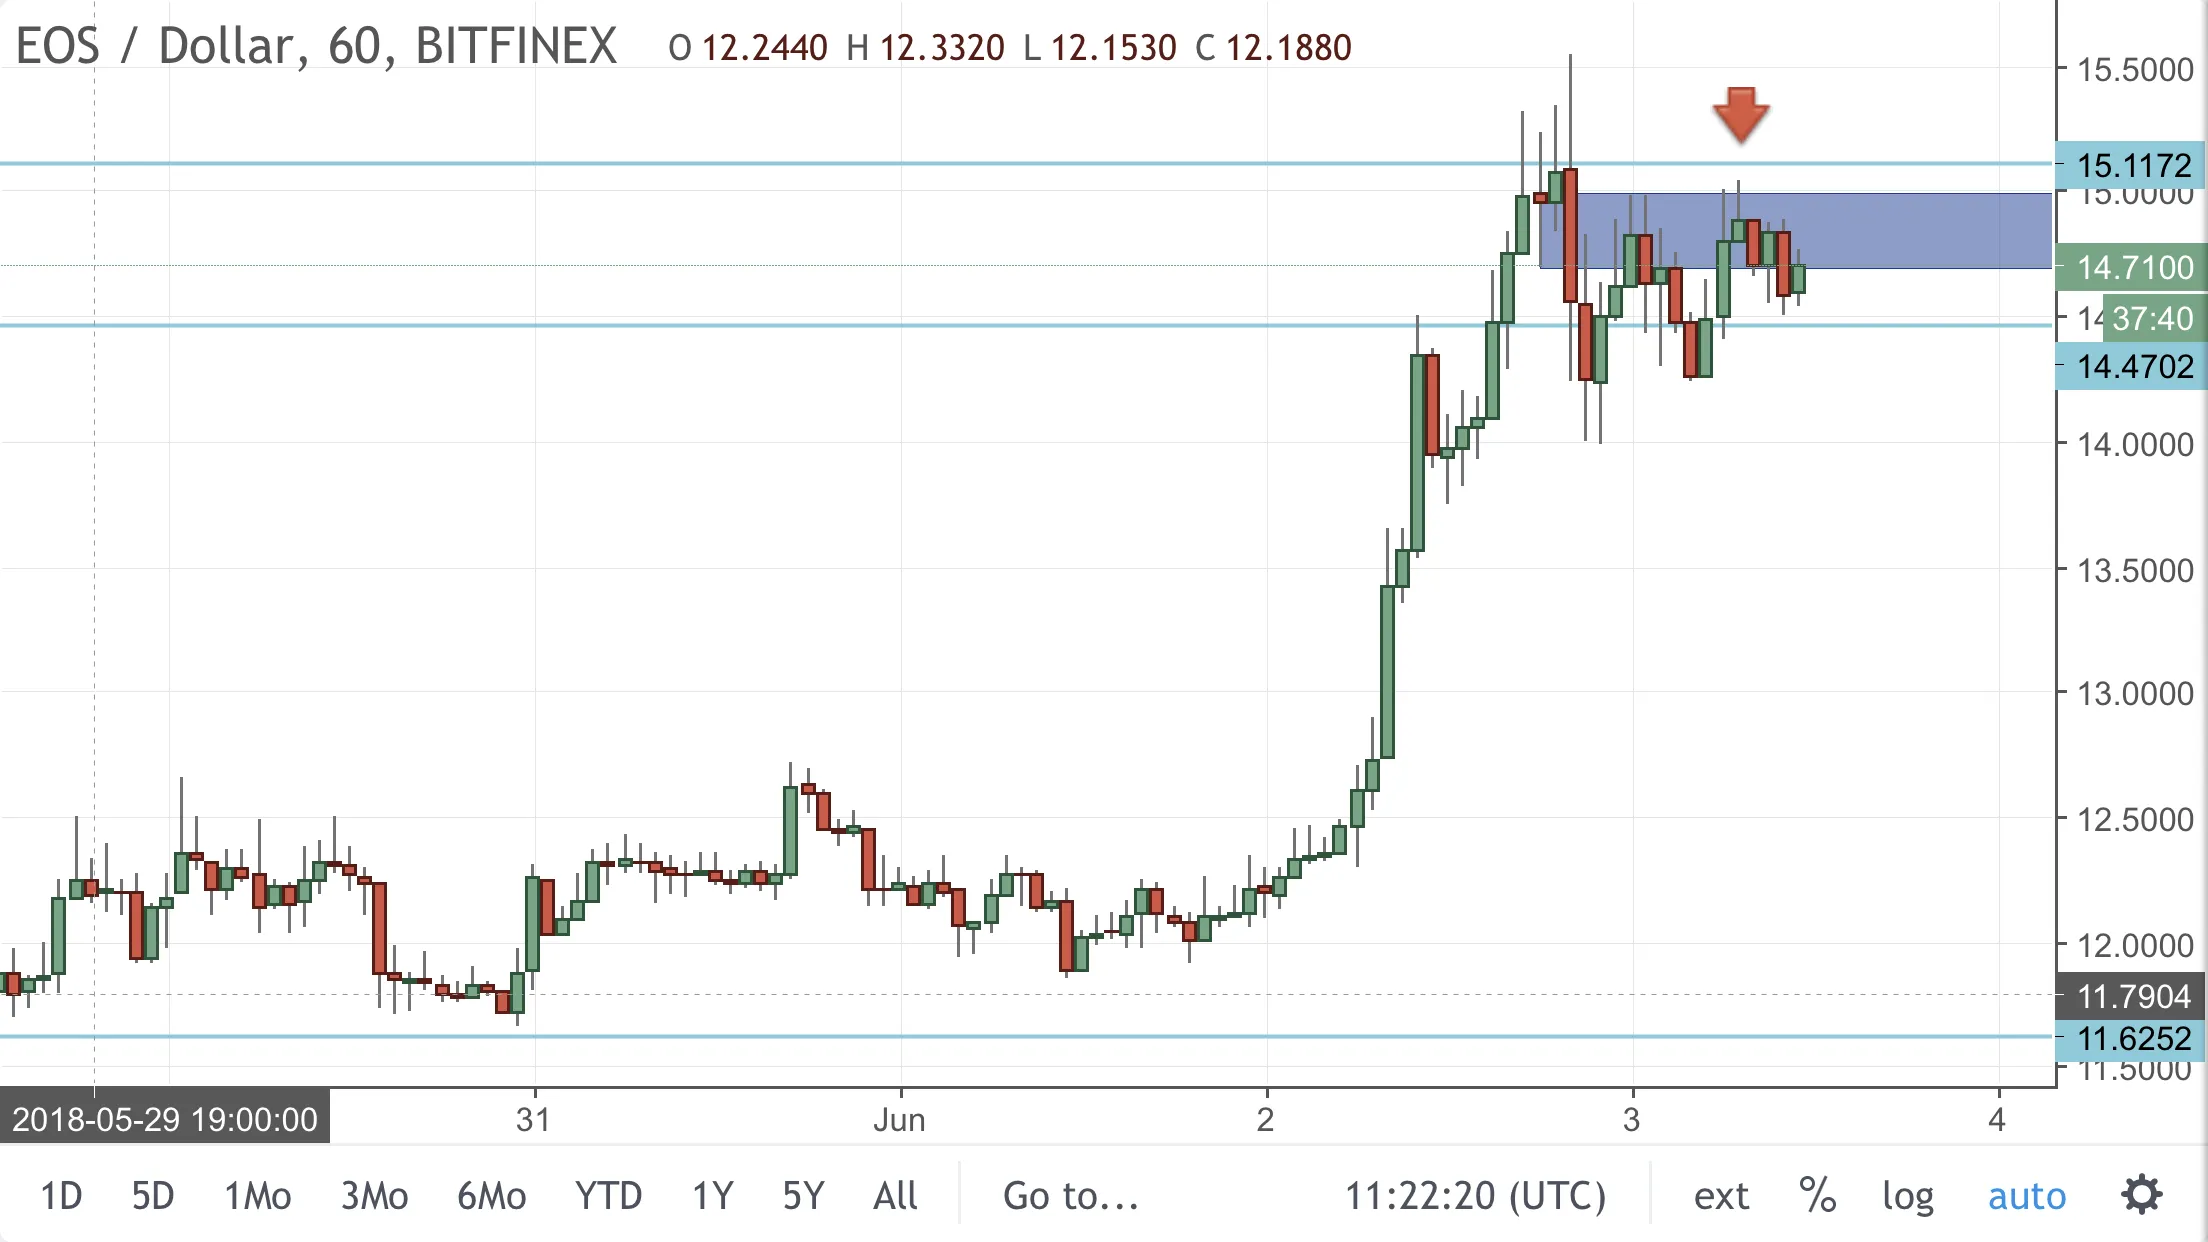
After the successful mainnet launch, I’m more using this chart to see just how bullish EOS actually is. How often have we seen buy the rumour, sell the news price action unfold.
Is EOS any different? Time will tell.
✌🏻.
@forexbrokr | Steemit Blog
Market Analyst and Forex Broker.

Twitter: @forexbrokr Instagram: @forexbrokr
Leave a comment to chat about forex and crypto trading mentorship.
Return from After the EOS Mainnet Launch, How Strong is Price? to forexbrokr's Web3 Blog
