

Afternoon team,
On Friday, I asked whether I'm an AUD/USD buyer or seller, based on where price sat in relation to the higher time frame trend line sitting on our chart.
I'm not sure how you could possibly miss it, but if you need a refresher of the trend line that I'm referring to, take a look at the updated AUD/USD daily chart below:
AUD/USD Daily:
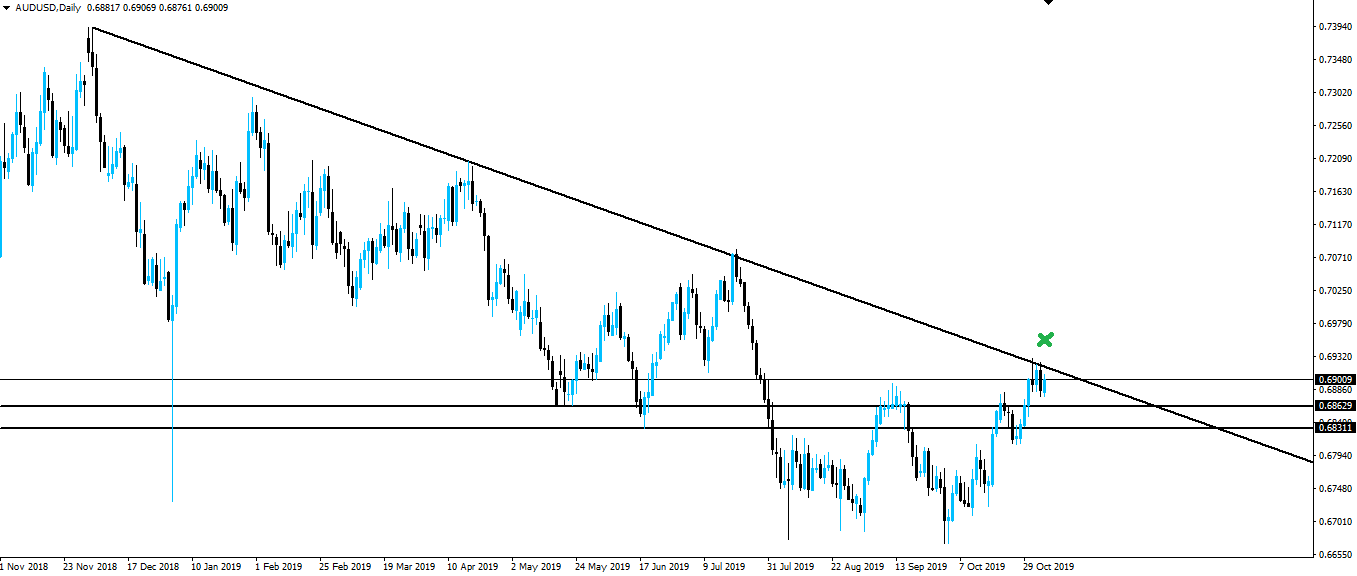
The way that I approach my forex market analysis is fairly black and white. If price is above higher time frame support, then I'm looking to buy. If price is below higher time frame resistance, then I'm looking to sell.
You can see that in this case, price has tested the higher time frame trend line as resistance, and has remained capped by the level.
So if I'm using the above logic here, then as long as price is below this level, then I'm only looking to short. Something that you need to keep in mind when reading today's Inner Circle email.
See you in your inbox...
Best of probabilities to you,
Dane.
Return from AUD/USD Remains Capped by Daily Trend Line Resistance to forexbrokr's Web3 Blog
