

Hey guys,
I know you might not want to analyse your charts right now, but have you taken a look at where Bitcoin is actually sitting?
Yes we might be in the midst of a market wide bloodbath, but we’re also sitting very nicely within a higher time frame support zone where price has historically ripped in the past.
Take a look at the daily below:
BTC/USD Daily

See what I mean? Just look how hard price ripped out of that zone when price touched t previously.
The key to using these support zones is to look at the way that price has bounced from the level.
BTC/USD Hourly
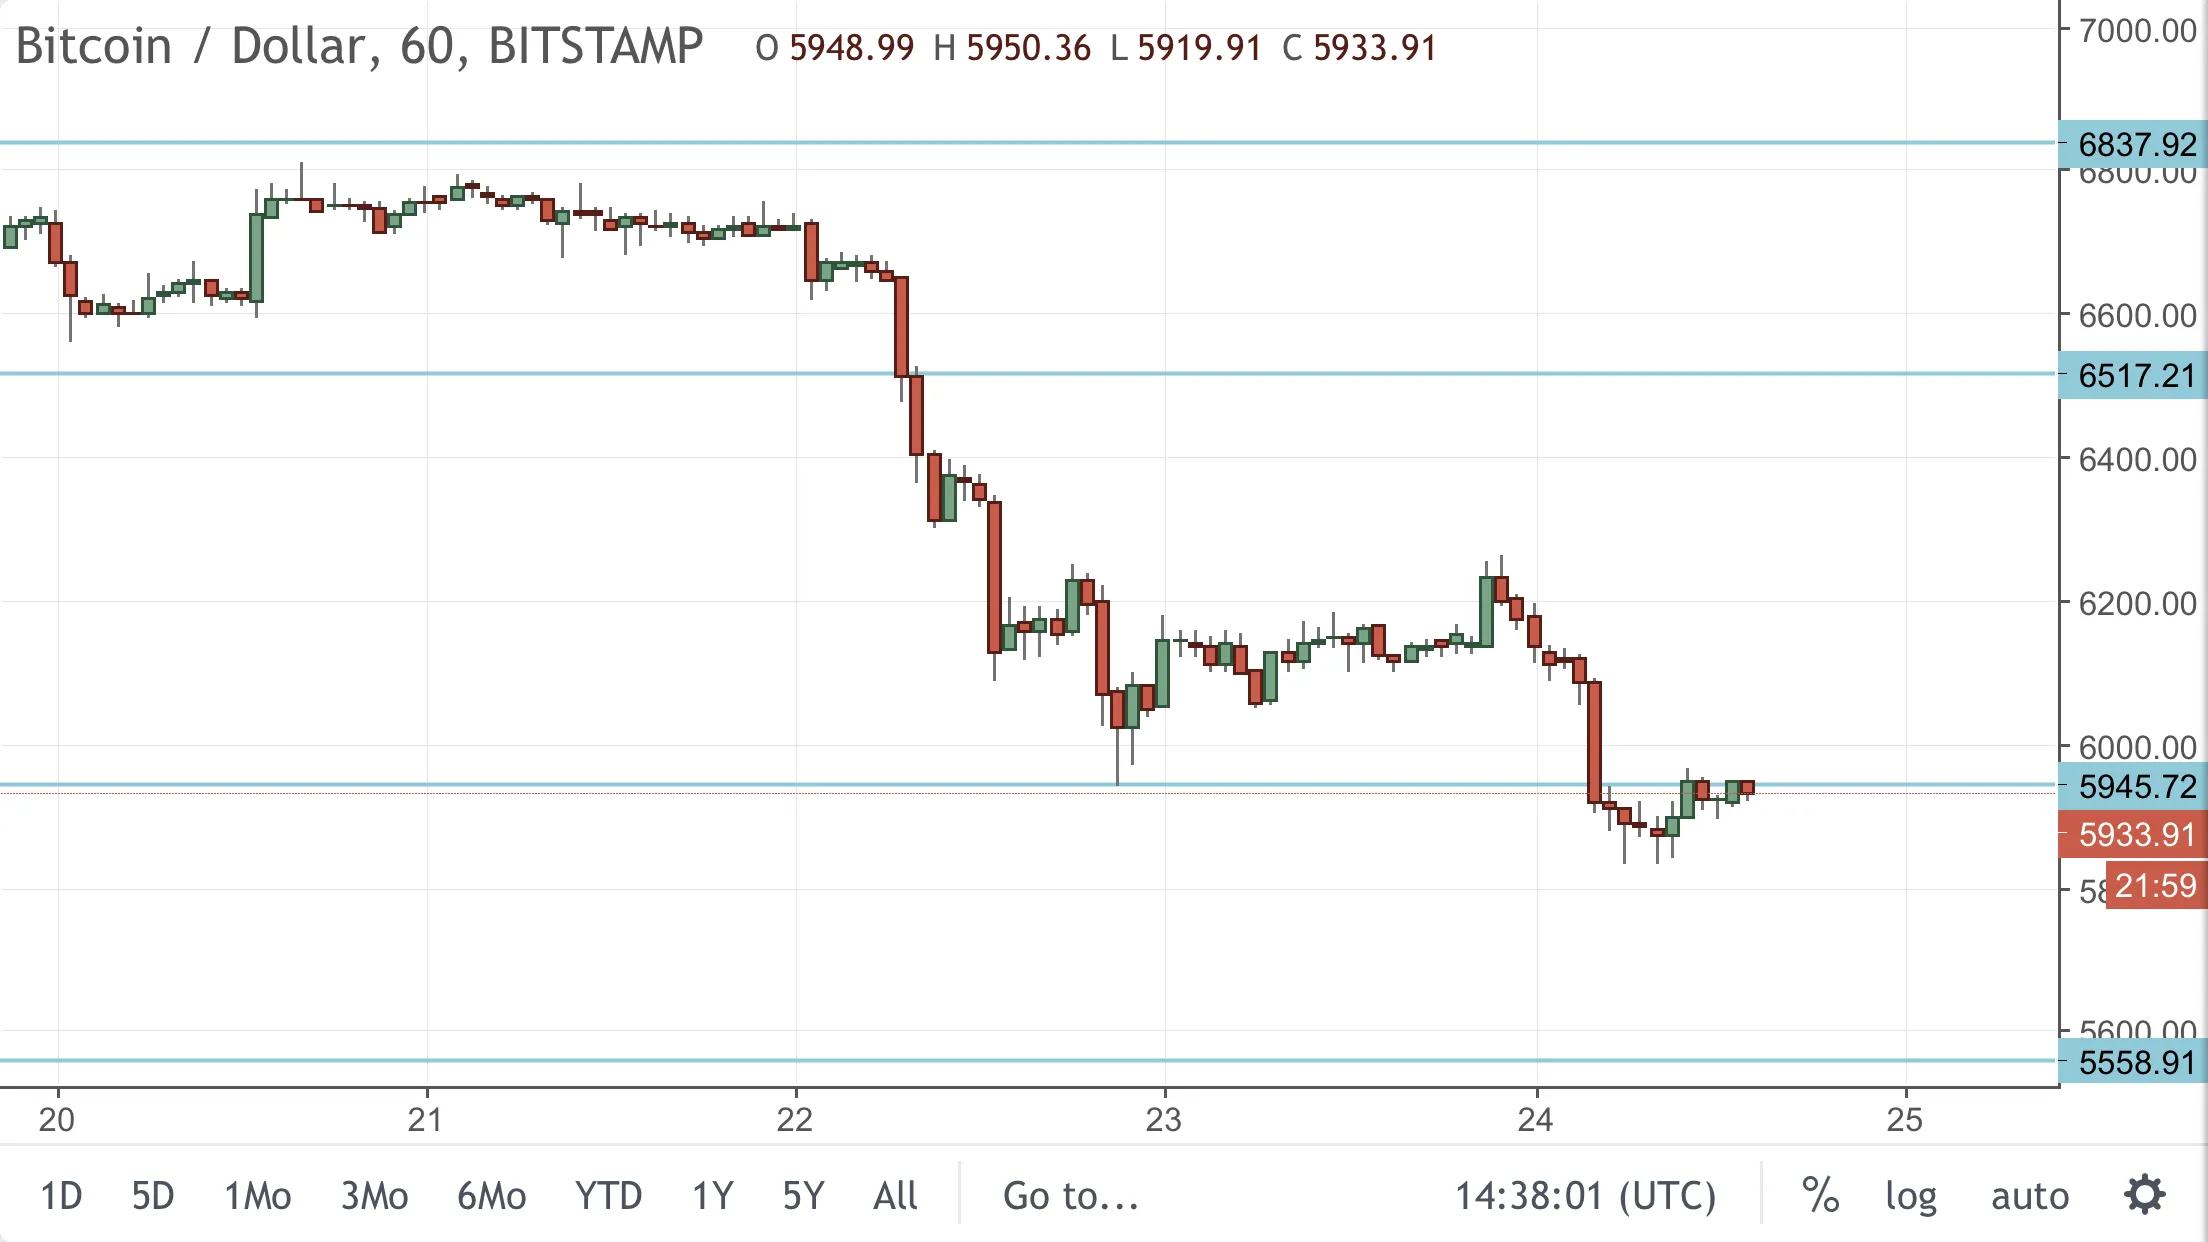
Now we wait until we see a reaction on the intraday charts.
✌🏻.
@forexbrokr | Steemit Blog
Market Analyst and Forex Broker.

Twitter: @forexbrokr Instagram: @forexbrokr
Leave a comment to chat about forex and crypto trading mentorship.
Return from Bitcoin at Support Zone Where Price has Historically Ripped to forexbrokr's Web3 Blog
