

BTC/USD Technical Analysis
Morning team,
We've been following Bitcoin above daily support for a few months now, ever since it first broke above the zone in early May.
The zone is a pretty obvious one that you can see on the updated Bitcoin daily below.
BTC/USD Daily:
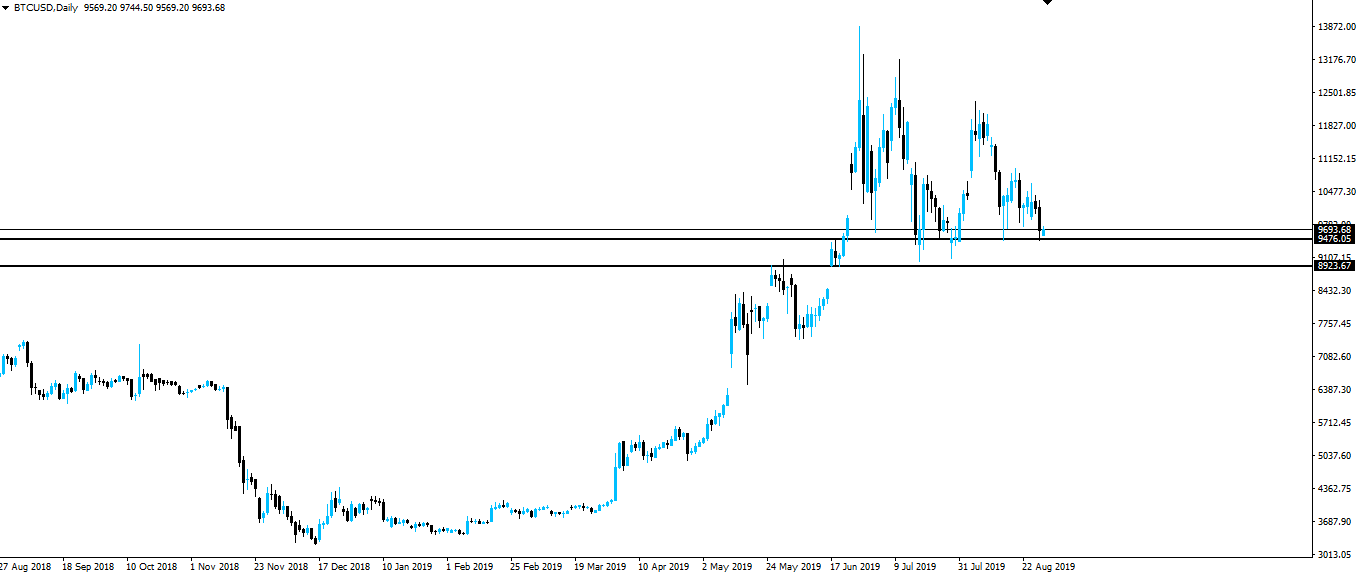
As long as we are above this higher time frame support/resistance zone, I'd rather be a buyer than a seller. Higher time frame is king and I want to be on the right side of the market when I do decide to take a position.
But take a look at that dump we got at the end of yesterday's trading session. The hourly shows it well below.
BTC/USD Hourly:

That's nearly a $1,000 drop in essentially a single hourly candle. Yikes!
But look at where price was stopped in its tracks. On the top line of our higher time frame support/resistance line. EXACTLY to the pip.
Now of course Crypto-Twitter is going to try to make reasons for why price dumped like that, but as an intraday trader, I don't care. It's all irrelevant noise.
Find your higher time frame levels for direction. Then zoom into the intraday charts to trade short term pullbacks that will allow you to hit high risk:reward trades.
Simple.
This is what I help traders to do inside my Inner Circle. Click the link and get involved:
Best of probabilities to you,
Dane.
Today's Economic Releases
Thursday: NZD ANZ Business Confidence AUD Private Capital Expenditure q/q USD Prelim GDP q/q
Join my Inner Circle ⭕️ - www.forexbrokr.com
Return from Bitcoin Dumps - Still Remains Above Daily Support to forexbrokr's Web3 Blog
