forexbrokr Blog Banner

forexbrokr

Bitcoin - If This Level Goes, It Changes Everything

92614955-16EB-49F2-975E-FD8AEA01D0A5.jpeg


The Bitcoin daily chart just tapped trend line support:

BTC/USD Daily

BB005B73-31E4-4FCB-8684-223F41B05FFE.png

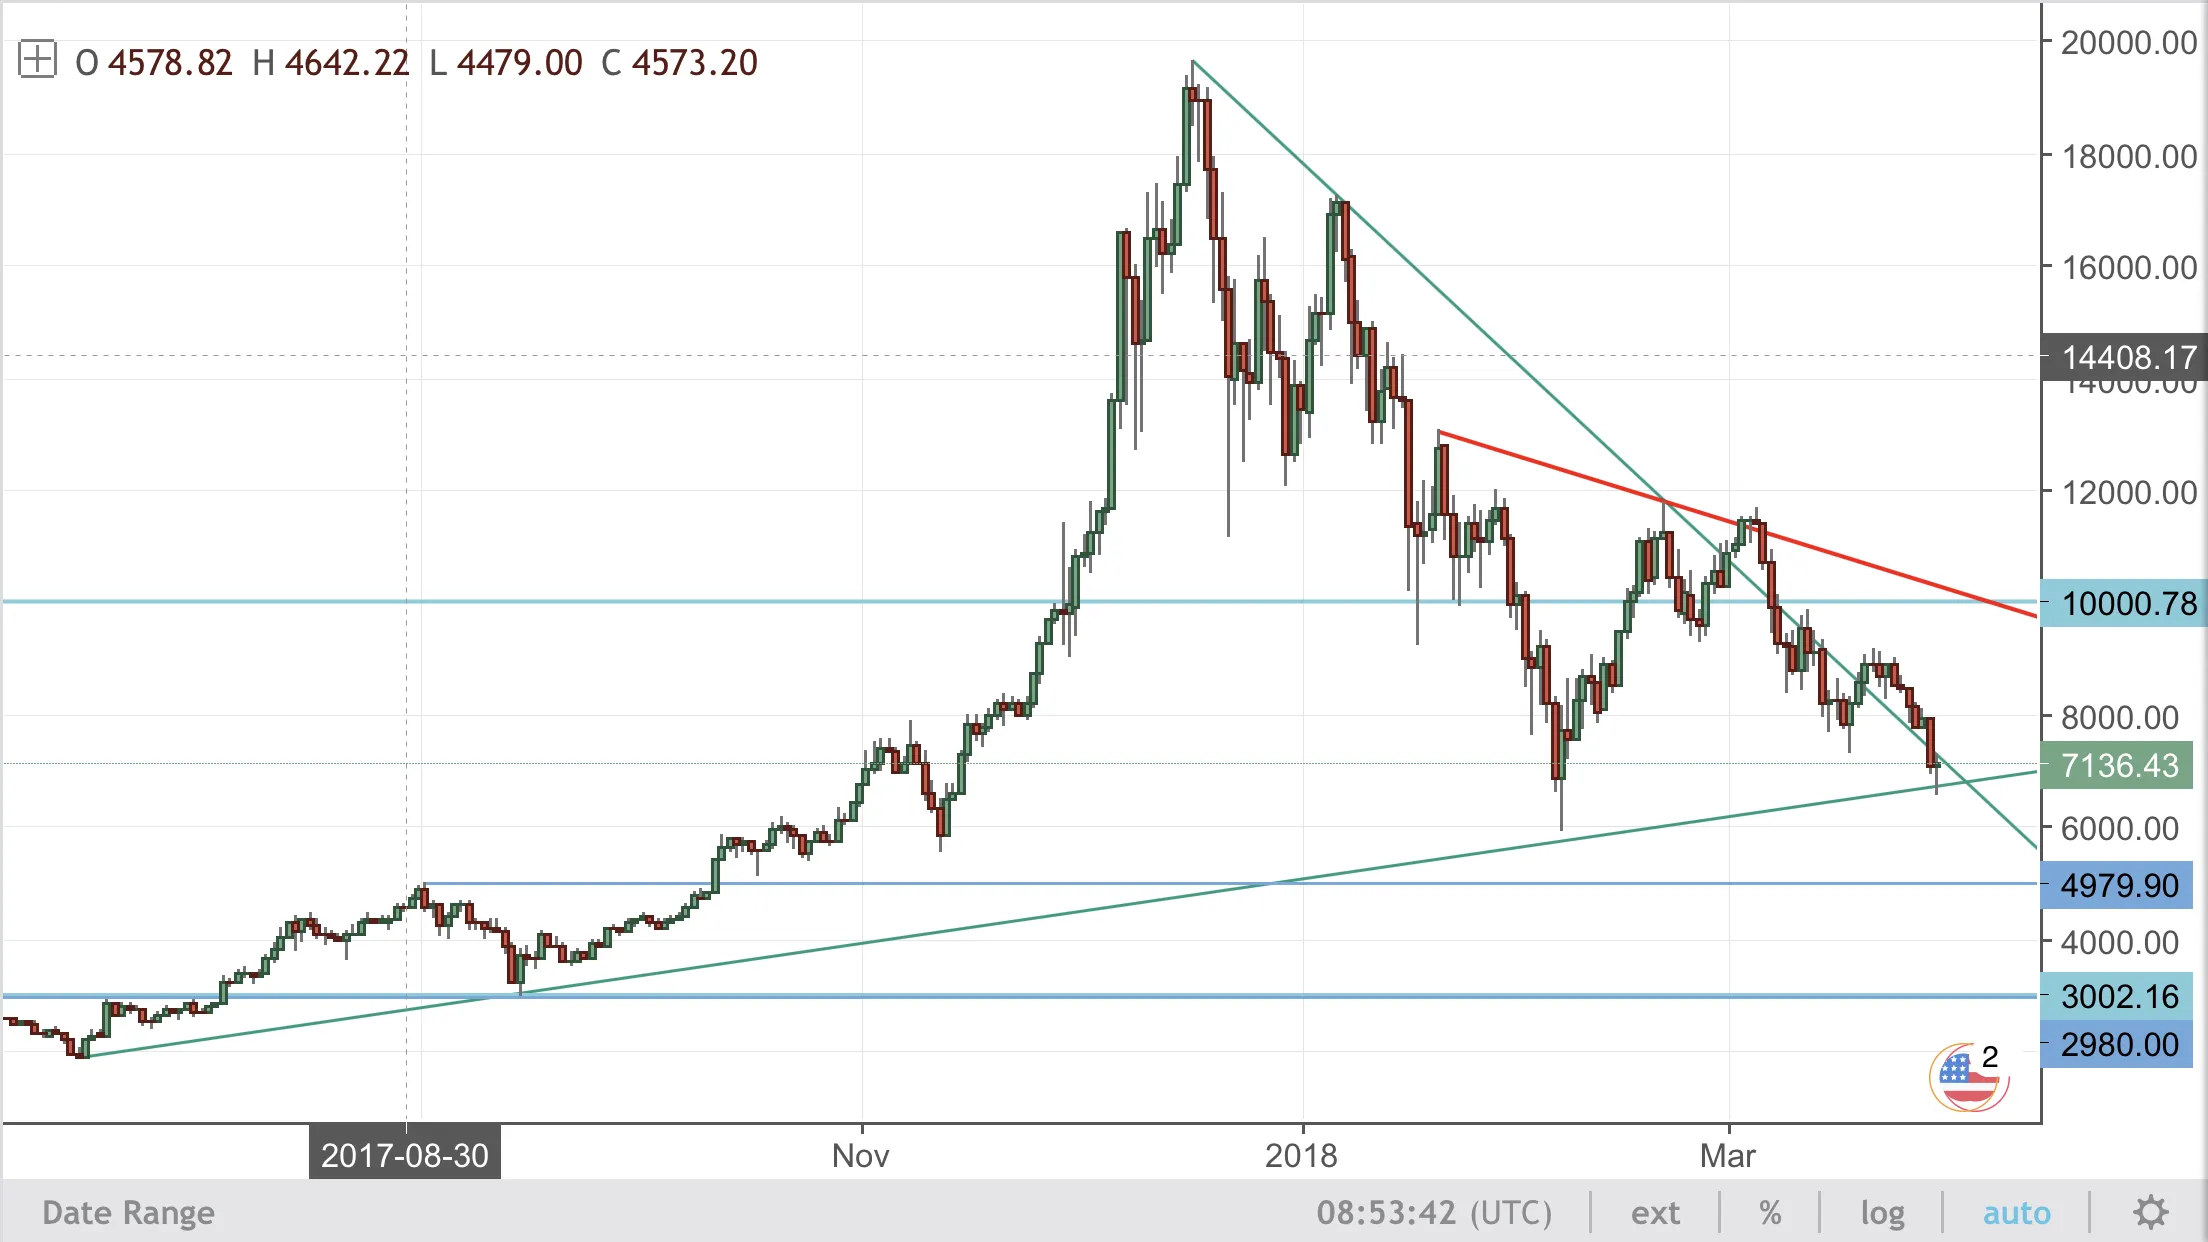
The trend line that the market is clinging to so we can say that the overall trend is still bullish.

If this level goes, it changes everything.

Now, take a look at the intraday price action on the bounce:

BTC/USD Hourly

38730C98-A10F-4EE5-B1BB-C327BA5E752F.png

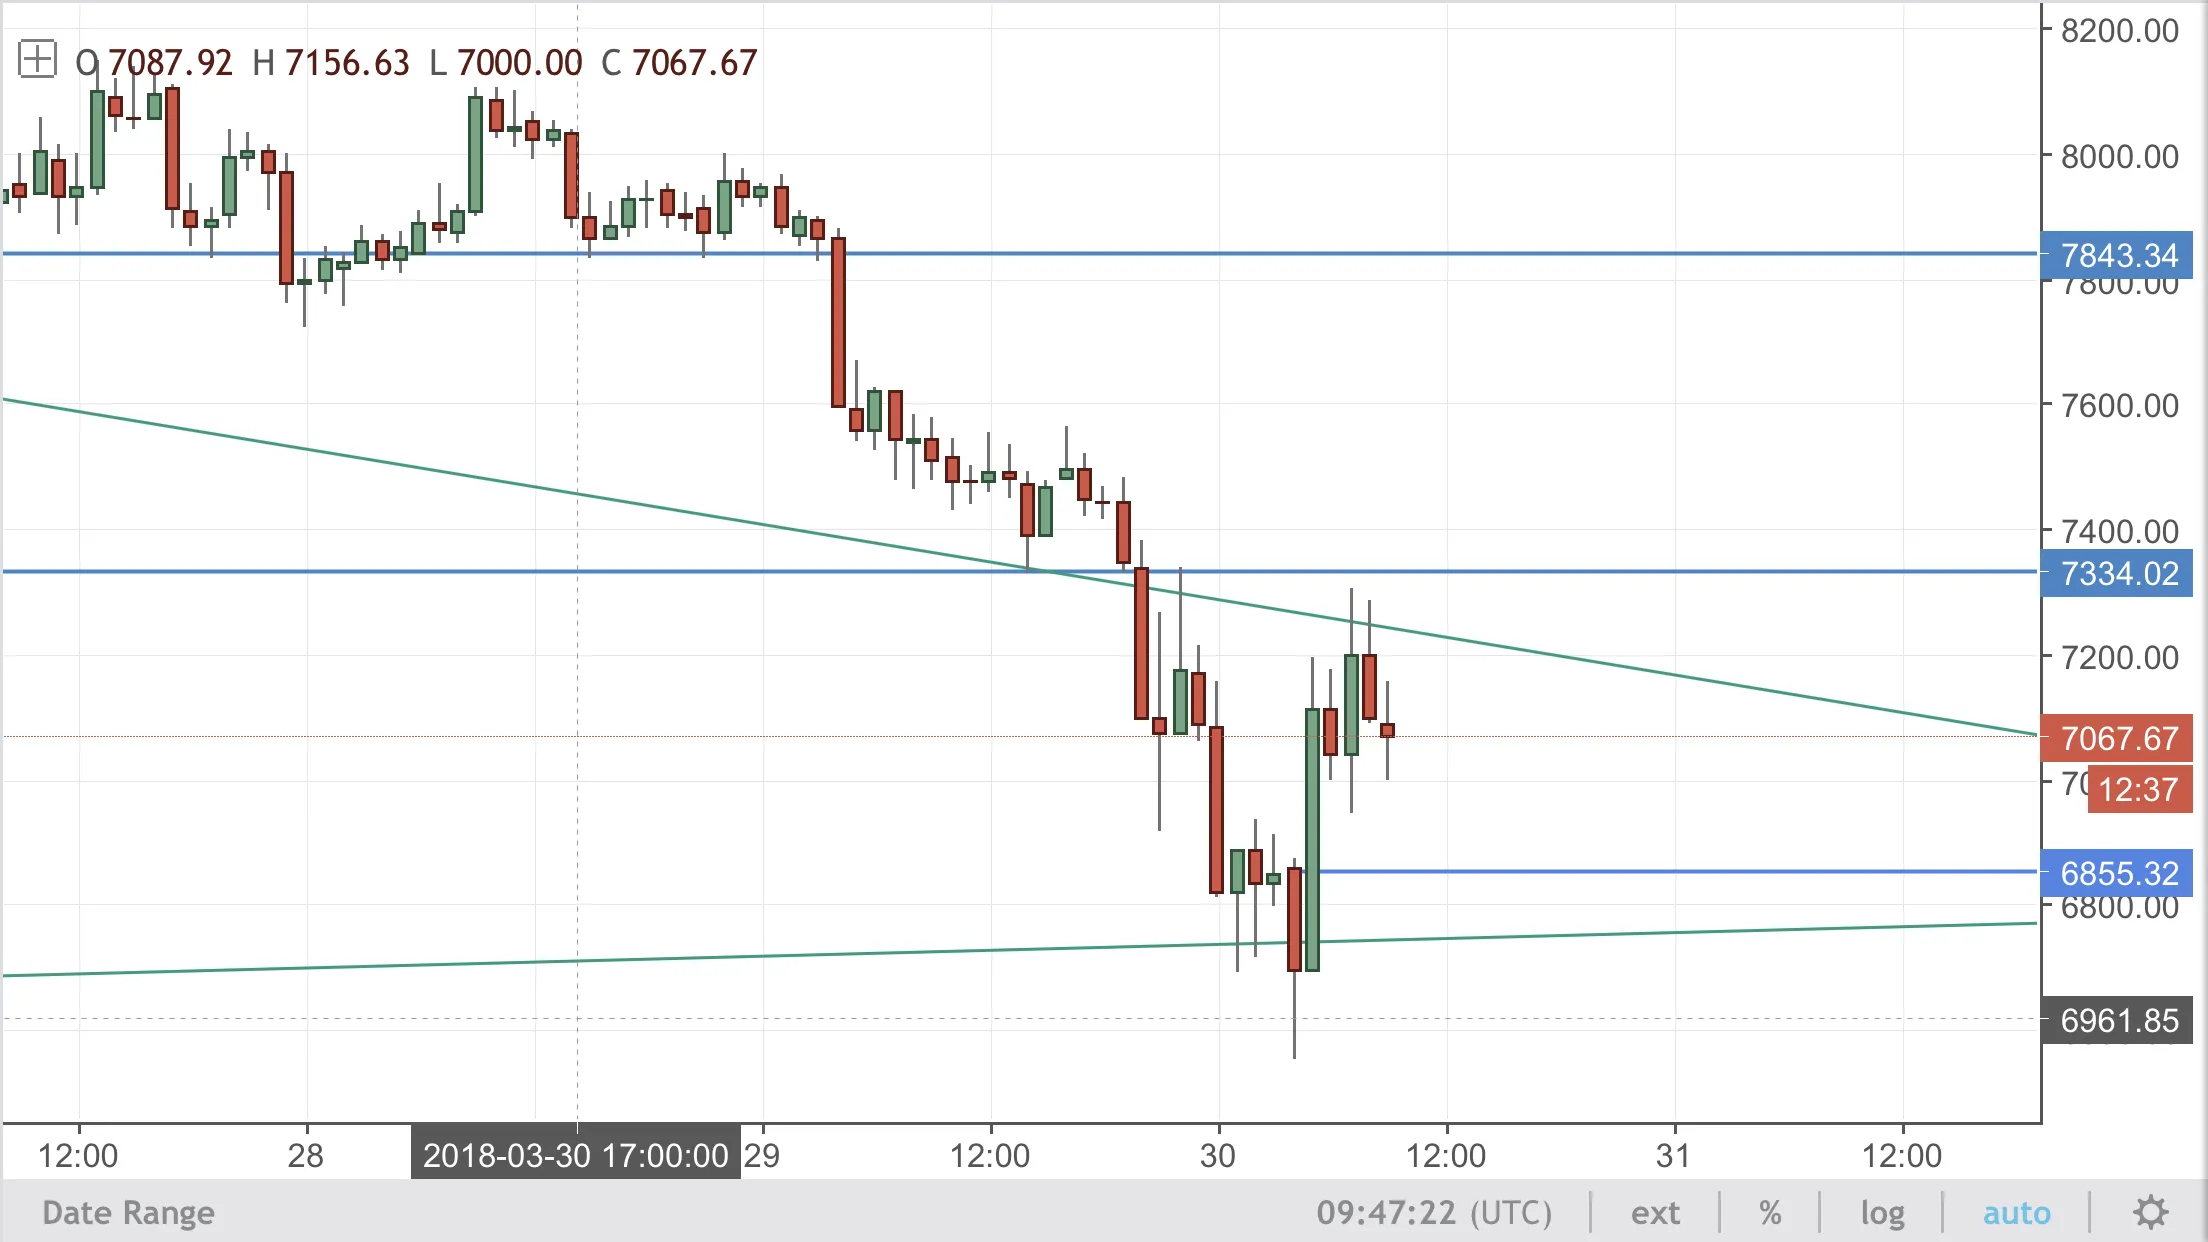
Price is bouncing and that is the intraday level that price would retest and need to hold for us to think about getting long yet.

Best of probabilities to you.

Peace ✌🏻.


Please ***leave a comment*** with your ideas or just share a chart.
Blogging about markets is all about sharing ideas and making us see all possible angles. I look forward to ***having you follow along*** and reading what you throw at me.
**Twitter:** [@forexbrokr](https://twitter.com/forexbrokr) **Instagram:** [@forexbrokr](https://www.instagram.com/forexbrokr/) **Website:** [www.forexbrokr.com](http://www.forexbrokr.com/)


Return from Bitcoin - If This Level Goes, It Changes Everything to forexbrokr's Web3 Blog

Bitcoin - If This Level Goes, It Changes Everything was published on and last updated on 30 Mar 2018.