

BTC/USD Technical Analysis
Afternoon team,
We're stepping back into the world of cryptocurrency for today's analysis, with a look at the mack-daddy. Yep, that's right, the one and only Bitcoin.
With Bitcoin STILL above daily support, we continue to to look for bullish price action that will hint at a more significant move higher and yesterday's daily candle could just be that.
Take look at the candle that I've marked on the BTC/USD daily chart below.
BTC/USD Daily:
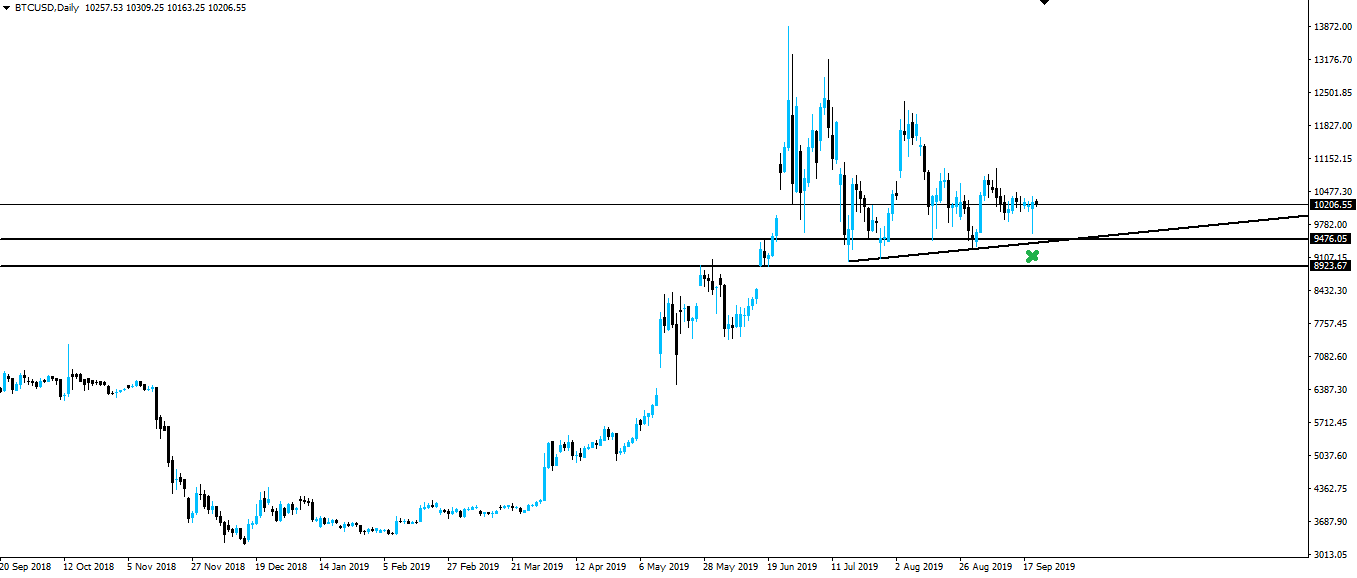
A big long wick, with a small bullish body at the top. While it's not a textbook hammer, it's close enough to show that the bulls are battling to regain an element of control after a week or so of bearish drift.
When it comes to candle patterns, nothing is textbook. If you sit around and wait for the perfect candle to form, then you're going to be waiting a pretty damn long time.
Just like your placement of support/resistance zones, candle patterns are an art rather than a science.
Speaking of support/resistance zones, look at where this hammer has formed!
After price has drifted down for the last week, this hammer actually formed after spiking down into our higher time frame support/resistance zone. Adding to the weight that the hammer actually means something.
As I've often spoken about, candle patterns like hammers in isolation mean little. But if they form at the end of bearish trends, at higher time frame support/resistance, then they certainly do.
To me, that's what we're looking at here.
Those inside my Inner Circle have already made some money trading Bitcoin around this higher time frame zone. If you want to get involved, then click the link below and join us.
Best of probabilities to you,
Dane.
Today's Economic Releases
Friday: CAD Core Retail Sales m/m USD FOMC Member Rosengren Speaks
Return from Bitcoin Prints Daily Hammer on Higher Time Frame Support to forexbrokr's Web3 Blog
