

Direct from the desk of Dane Williams.
After Bitcoin ripped higher off support into the halving, we've seen it rocket all the way to 10K.
Remember it's the weekend so my MT4 broker's charts haven't updated since then, but to keep my higher time frame analysis consistent, I've shared it anyway.
Take a look at the significance of the 10K level on the daily chart below.
BTC/USD Daily:
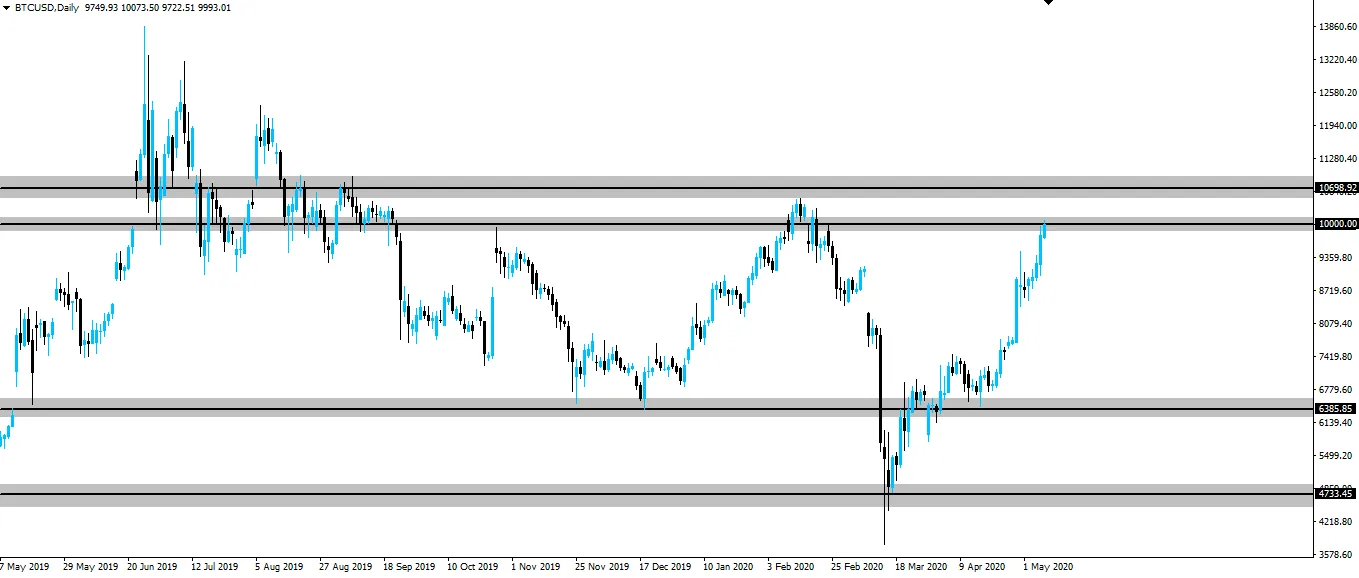
With price hitting major psychological resistance on the higher time frame chart and no doubt some sort of sell the fact going to happen post-halving, there's an opportunity to daytrade BTC/USD short.
Now zoom into an intraday chart (I've used TradingView here so it's live on Sunday) and have a look at the price action.
BTC/USD Hourly:
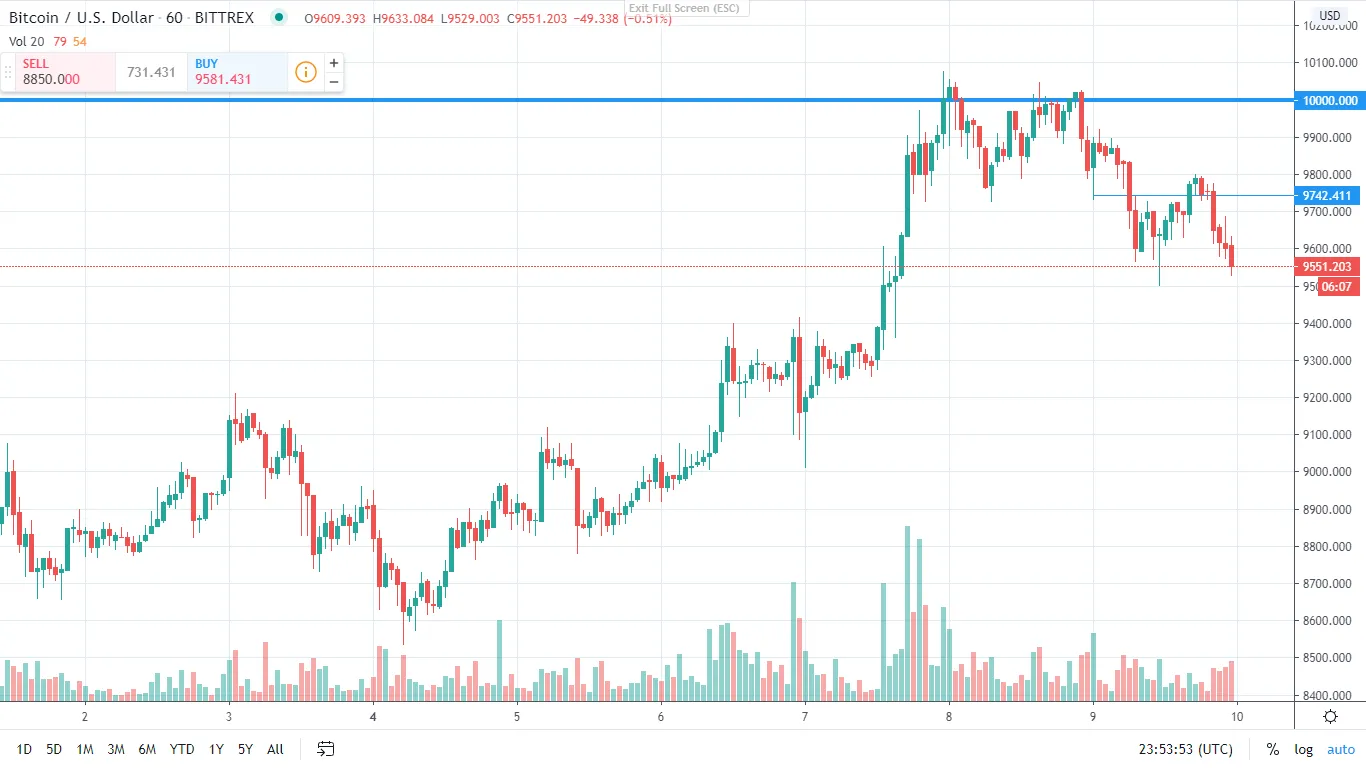
We have price being rejected off higher time frame resistance and then forming a stepping pattern intraday.
I've marked the first level of short term support turned resistance that is an opportunity to short into.
Manage your risk around either the intraday level or the higher time frame level, depending on how aggressive you are.
Best of probabilities to you,
Dane.
FOREX BROKR | Hive Blog Higher time frame market analysis.
Posted Using LeoFinance
Return from Bitcoin Short Opportunity Off 10K Psychological Resistance to forexbrokr's Web3 Blog
