
### EUR/NZD Key Points
- EUR/NZD price breaking out of higher time frame trend lines, no matter how they're drawn.
- But pushing into strong, horizontal resistance zone.
- Comes down to how price reacts within this zone as to which way we trade it.
EUR/NZD Technical Analysis
Morning team.
It's been a big week for us in the markets and while I could just write about shorting USD/JPY again, because it gave us ANOTHER chance without breaking resistance), I thought I'd focus on a request I got on Twitter - EUR/NZD.
After taking a look at my charts and going through some levels on different time frames, it looks to me like it all comes down to the daily chart:
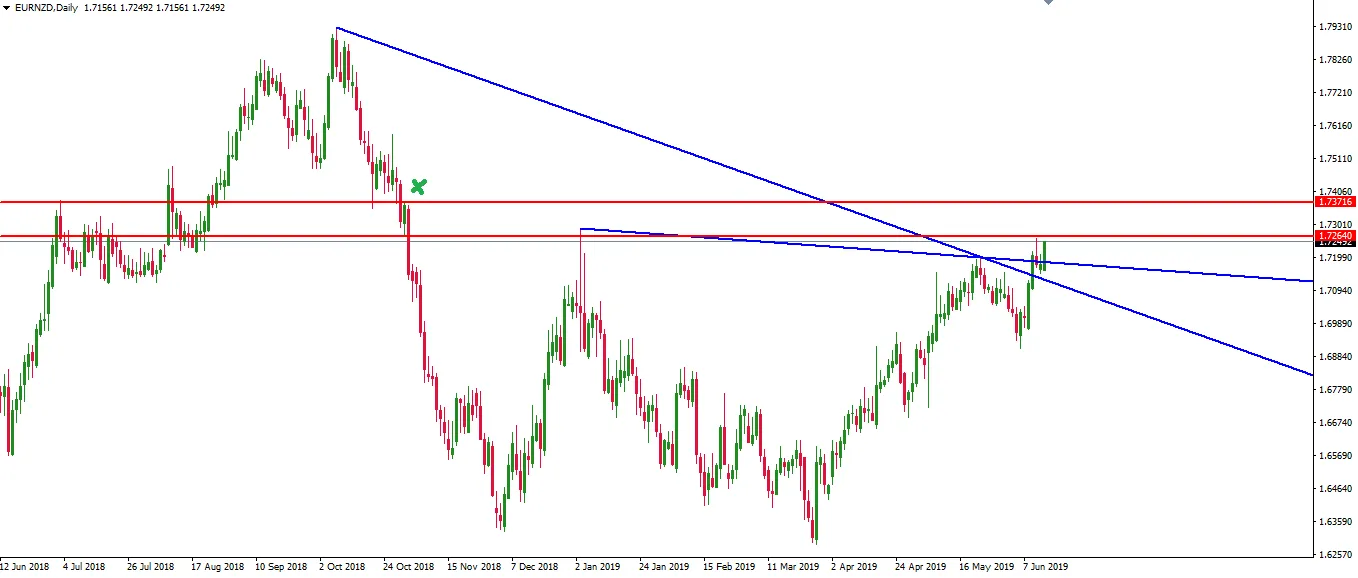
We know that higher time frame is king and while price has broken out of that trend line (no matter how you draw it), it is still capped by clear as day horizontal resistance.
You can't trade a breakout into resistance with any confidence, so it's still a wait and see as to what price does when it gets into this zone.
While it's below the zone I'd be looking for weak price action on the intraday chart. If it breaks above, then the breakout is on and I'd be looking to long. Either way, that's your zone to manage your risk around and look for pullbacks close to for entries.
Right now, just looking at an intraday chart, I can see that price is testing swing high resistance. I'm interested to see if this fails because if it does, then we've got an intraday doule top under higher time frame resistance.
That' would be good enough for me to look for shorts with good risk:reward.
Best of probabilities to you.
Dane.
Upcoming Economic Releases
USD Core Retail Sales m/m USD Retail Sales m/m
Return from EUR/NZD Trend Line Breakout Capped by Horizontal Resistance Zone to forexbrokr's Web3 Blog
