

Afternoon team,
While I have been mentioning the pair in my weekly market previews, I haven't done a dedicated GBP/USD analysis blog for a few weeks now.
However, with markets gaining confidence from Brexit negotiations recently, Cable has been ripping the absolute faces off shorters and destroying resistance zones on our higher time frame chart.
Take a look at the GBP/USD higher time frame in question on the daily chart below.
GBP/USD Daily:
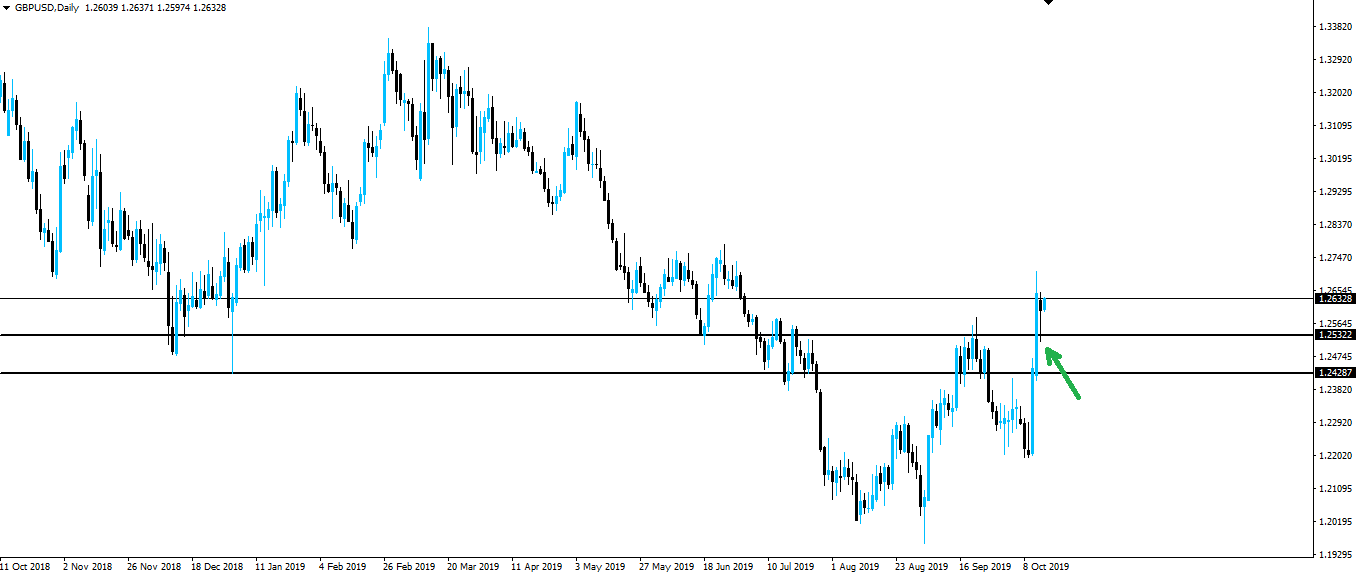
You can see that to end the week, GBP/USD printed those two huge daily candles and blew straight through the zone. Not even pausing to test it as resistance. So does that mean the zone was wrong, or that looking for these levels doesn't work?
Not at all! All it means is that it took a strong, momentum move to break out of the zone. It is still highly significant.
To highlight that point, just take a look at how price has reacted to the zone after breaking out of it. See the wick down that I've marked with an arrow on the chart above?
While the bulls had too much momentum to be halted at resistance, they did retest the zone this time as support after breaking out. A highly bullish signal.
I'm now switching over to my Inner Circle ⭕️ email to talk about how we can go about trading GBP/USD. The setup looks like a juicy one to me!
Best of probabilities to you,
Dane.
Return from GBP/USD Bulls in Charge as Zone is Retested as Support to forexbrokr's Web3 Blog
