

GBP/USD Technical Analysis
Evening team,
I'm a bit late with today's blog and daily email, but I've been letting this one play out and hopefully it was worth it.
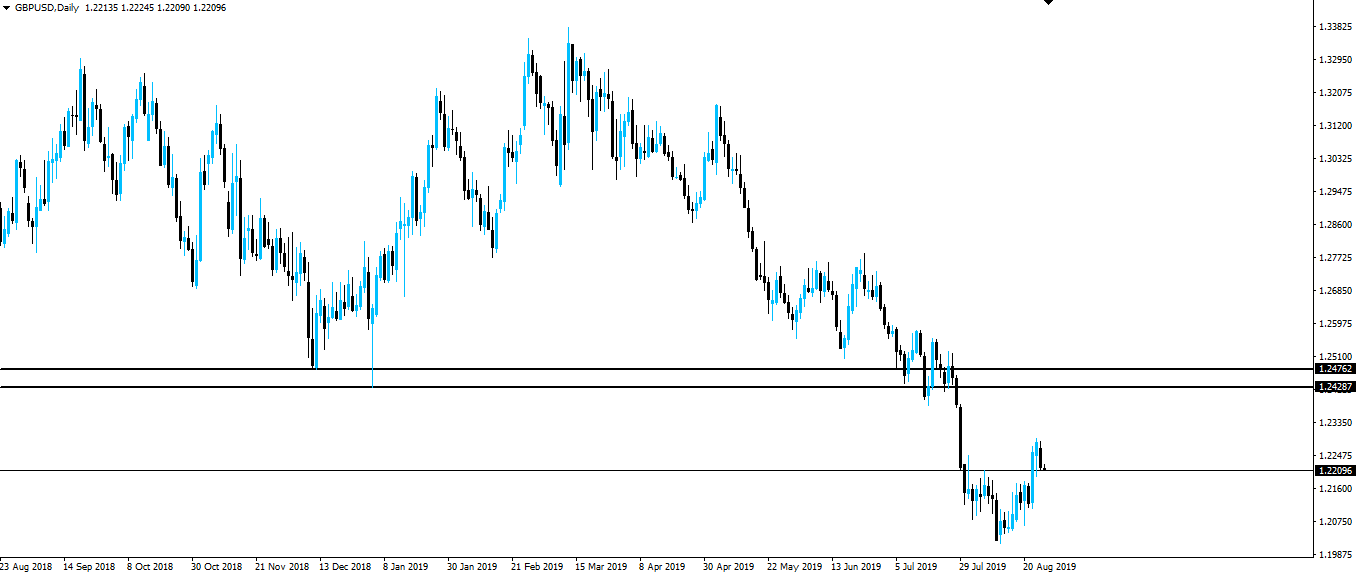
Remember, GBP/USD has been trending lower for months now, with no end in sight. In last weekend's market preview, we highlighted that price was below higher time frame resistance, but maybe a little too far lower to use it as a level to manage risk around.
Take a look at the daily and you'll see how price is in the no-man's-land that I'm talking about.
GBP/USD Daily:
But zoom into a 4 hourly chart and you can see why I might be a little more interested in potentially shorting at these levels.
GBP/USD 4 Hourly:
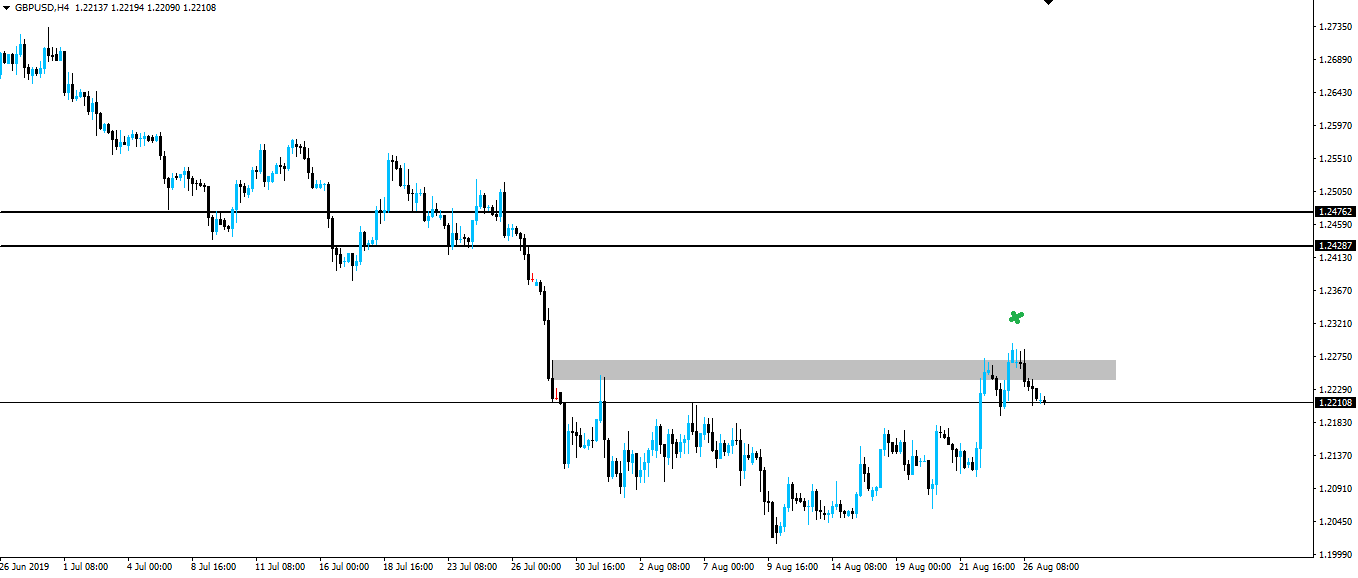
The zone I've drawn is actually from the hourly, but the 4 hour chart shows the tops of the candles I'm using as resistance, perfectly.
So we have price below higher time frame support/resistance, then retesting an intraday area of short term support turned resistance.
Price has poked though it, hopefully cleared out a few stops above, and has now reactivated it as resistance. That is the sort of price action that often precedes a nice run lower.
It's now time to zoom in again and trade the shit out of this one inside my Inner Circle.
Want to join? Then click the link and get involved:
Best of probabilities to you,
Dane.
Today's Economic Releases
Tuesday: USD CB Consumer Confidence
Join my Inner Circle ⭕️ - www.forexbrokr.com
Return from GBP/USD Hits Short Term Support Turned Resistance in No-Man's-Land to forexbrokr's Web3 Blog
