

Afternoon team,
Back after a Wednesday off yesterday. I just got caught up in real life and missed my first weekday blog in quite a while. Writing consistently has become part of my daily routine and it did feel off to miss even just the one day.
What it did do however, was give the GBP/USD long trade that I shared with my Inner Circle email on Tuesday, a chance to play out. And play out it did.
Take a look at the higher time frame price action below.
GBP/USD Daily:
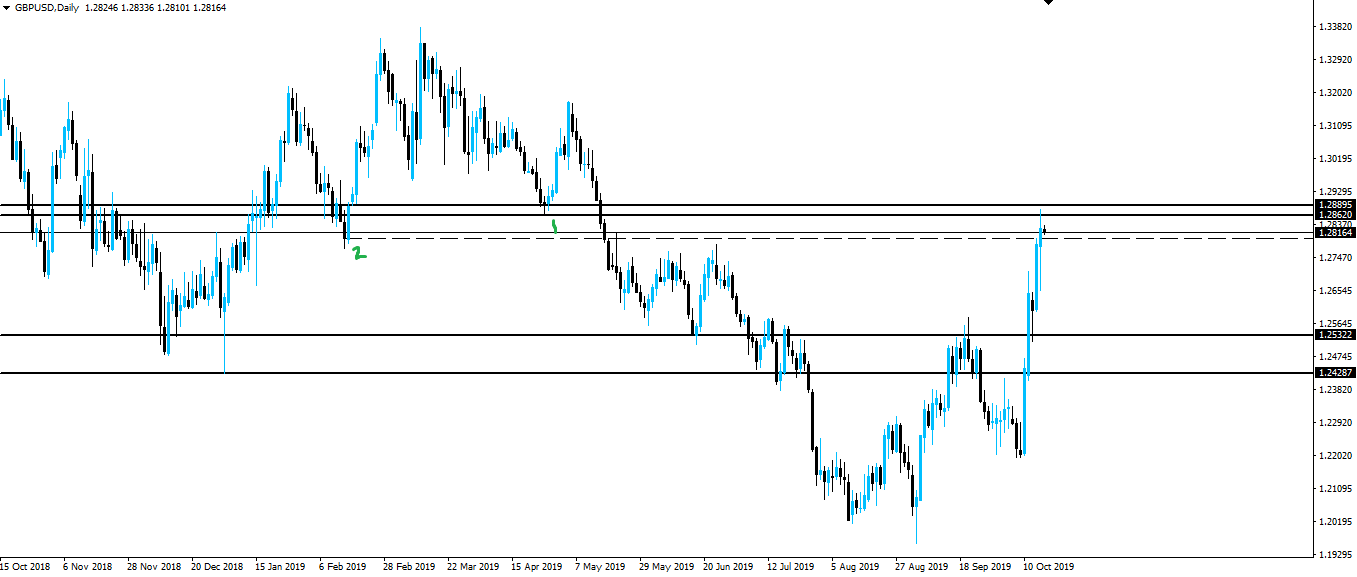
So what this chart clearly shows is that price broke through resistance, retested resistance as support and has now moved straight up to the next zone.
I've marked the area I've drawn the next higher time frame support/resistance zone from at #1. I've chosen that and not #2, simply because that's where price has turned.
Support/resistance zones are never black and white. Nothing is exact here and you have to go with where price has most recently reacted.
Best of probabilities to you,
Dane.
Return from GBP/USD Moves Straight to Next Zone of Resistance to forexbrokr's Web3 Blog
