

Direct from the desk of Dane Williams.
I don't normally include tight triangles with trend lines like this on my charts because they get chopped so easily.
But with Gold sitting right on support and the triangle being so obvious even without drawing it, I just threw it on.
Take a look at the higher time frame chart below and you'll soon see what I mean.
XAU/USD Daily:
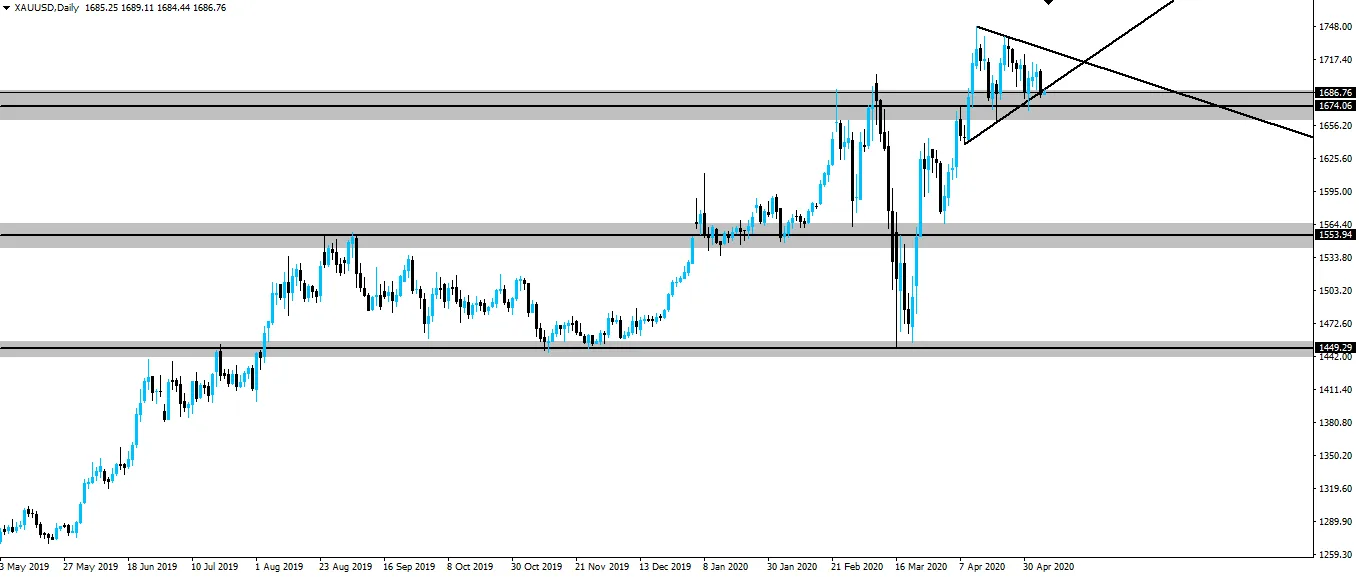
Here are a few quick, high level thoughts on this one.
- Gold is finding buyers at previous support turned resistance.
- Bitcoin is already ripping.
- Indices showing weakness at resistance.
Now zoom into an intraday chart such as an hourly and take a look for previous short term resistance turned support in order to buy off.
There's actually a really juicy zone that you can't miss.
Almost obvious enough to get me to start writing my daily email again...
Best of probabilities to you,
Dane.
FOREX BROKR | Hive Blog Higher time frame market analysis.
Posted Using LeoFinance
Return from Gold Coiled Up on Support, Ready to Pop to forexbrokr's Web3 Blog
