

Direct from the desk of Dane Williams.
Since we last took a higher time frame look at Gold, there's certainly been some juicy price action to trade.
Take a look at the move up between the last two levels of support/resistance on the updated daily chart.
XAU/USD Daily:
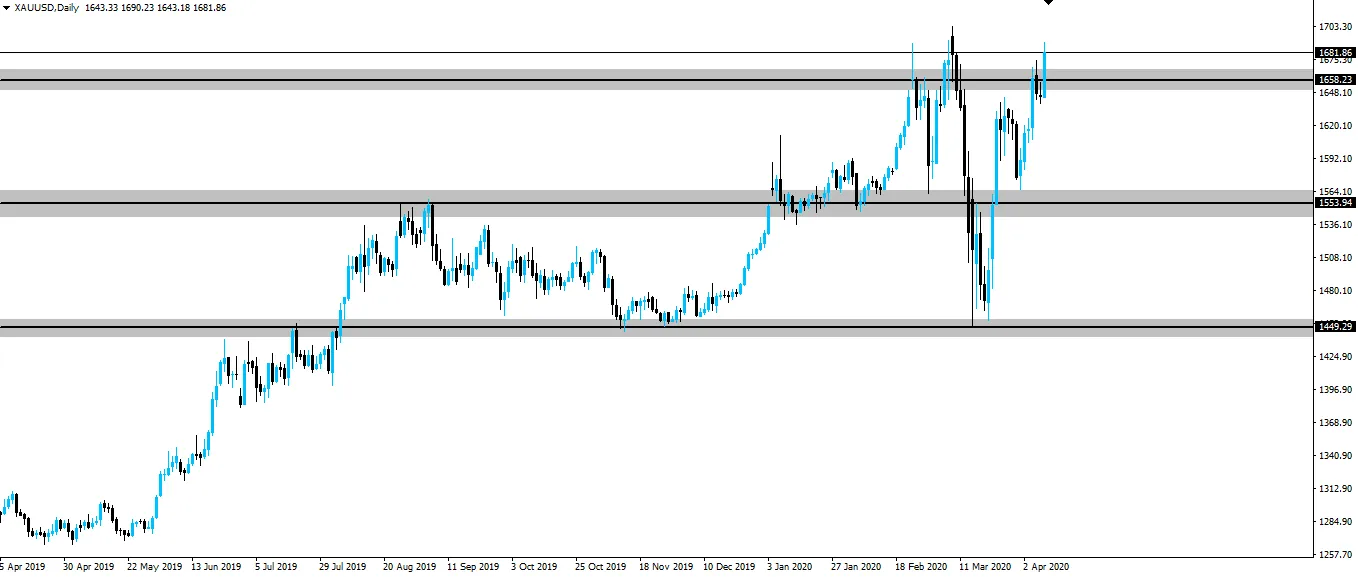
Just looking at those last two weeks of price action, we can certainly see that a lot has happened.
We had a breakout of resistance, followed by a retest of previous resistance as support.
Then the next resistance zone gave a bounce, before being broken and price currently trading near its highs.
Textbook price action showing price orderly moving between higher time frame support/resistance zones.
Mark your levels, then trade your levels.
Best of probabilities to you,
Dane.
FOREX BROKR | Hive Blog Higher time frame market analysis.
Return from Gold Trades Through Daily Resistance and Returns to Highs to forexbrokr's Web3 Blog
