

Direct from the desk of Dane Williams.
Flicking through my MT4 watchlist this morning it was the USDX that caught my eye.
With it being Sunday morning and markets closed, I wanted to quickly go over the concept of long term support/resistance zones slightly adjusting over time.
Something that is clearly shown on the USDX daily chart below.
USDX Daily:
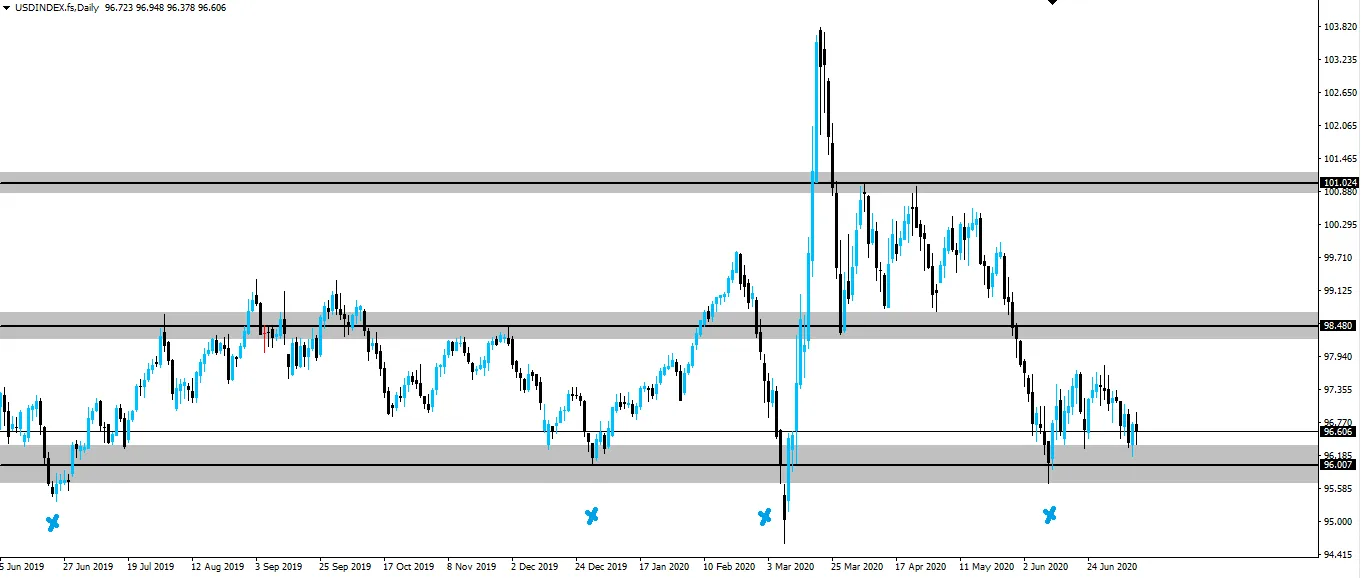
With price coming back down to retest one of the higher time frame zones on the index, I've marked each of the obvious touches that make it onto the screen, dating back to June 2019.
See how they're obviously respecting the zone, but each touch is from a slightly different price?
One common misconception about support/resistance is that it's there to act as some sort of barrier to price. This actually couldn't be further from the truth.
Support/resistance is not a barrier, but a zone where we expect business to be done, nothing more, nothing less. So as price comes back to retest the zone, it's never going to remain exactly in the same place or appear as an exact straight line on our chart.
As there is no exact science to placing support/resistance, I like to do 2 things:
- View support/resistance as a zone rather than a hard level.
- Adjust my zone to use the most recent bounce.
You can see that the USDX higher time frame zone that is now in play has been readjusted to use the most recent bounce.
We want a clear zone for risk management purposes and this is the best way I've found to draw zones that stay relevant over time.
Best of probabilities to you,
Dane.
FOREX BROKR | Hive Blog Higher time frame market analysis.
Posted Using LeoFinance
Return from How and Why I Adjust my Support/Resistance Zones to forexbrokr's Web3 Blog
