

Direct from the desk of Dane Williams.
Still following the Bitcoin price action, I've sat down at my desk this morning to read some Bitcoin drops/Bitcoin on sale headlines.
We know the financial media loves a good headline, but let's take a look at the price action to see what's really going on, shall we?
Start by bringing up a Bitcoin daily chart such as the one from my MT4 trading platform below.
BTC/USD Daily:
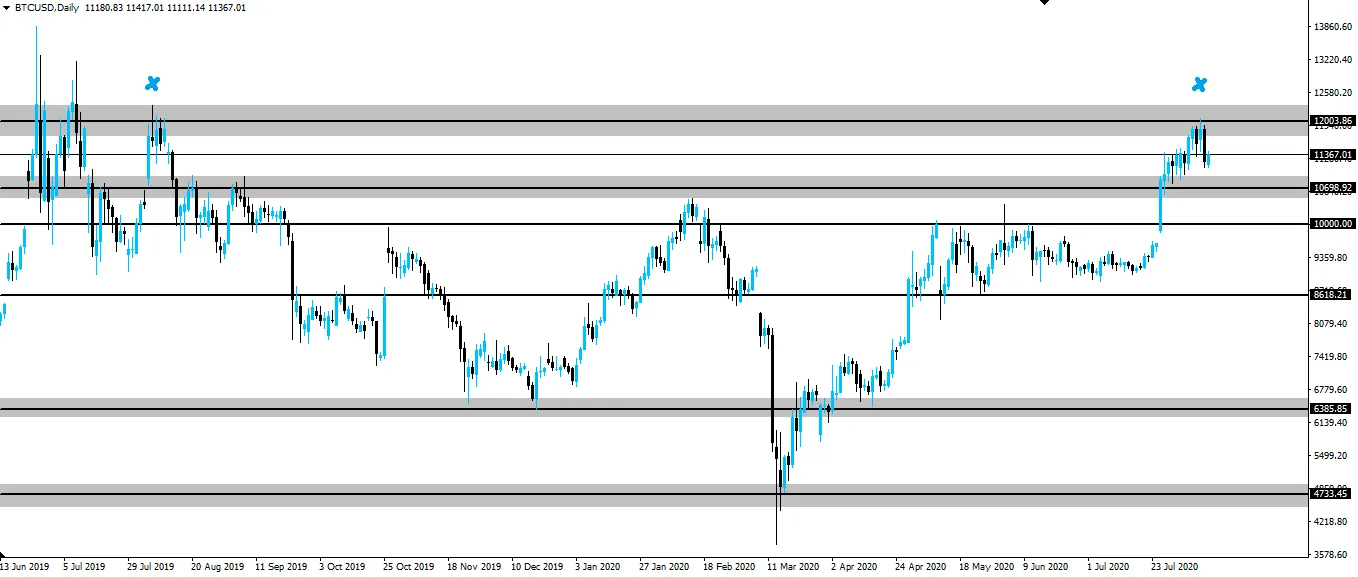
To find the most significant higher time frame resistance zone, all we need to do here is sinply scroll to the left and see what level that price last rejected from.
You can see on the Bitcoin daily chart above that the last time price was at the 12k level was back in 2019 when it rejected hard and wasn't tested again... until yesterday.
On this first retest, price rejected the level, confirming our analysis that the zone is significant and in play.
The fact that price didn't pull back all the way to the 10.6k zone where we were buying, shows that this move in what's essentially no man's land between zones, doesn't mean a whole lot.
Let price do what it wants between zones and we'll do our business more effeciently when price trades around them.
Best of probabilities to you,
Dane.
FOREX BROKR | Hive Blog Higher time frame market analysis.
Posted Using LeoFinance
Return from Let Bitcoin do What it Wants Between Zones to forexbrokr's Web3 Blog
