

Direct from the desk of Dane Williams.
With the NZD/USD and AUD/USD charts looking similar, I normally find myself trading the big brother Aussie.
But looking at where price has settled within this recent relief rally, it's actually the Kiwi that looks much more appealing.
Let's start by bringing up a weekly.
NZD/USD Weekly:
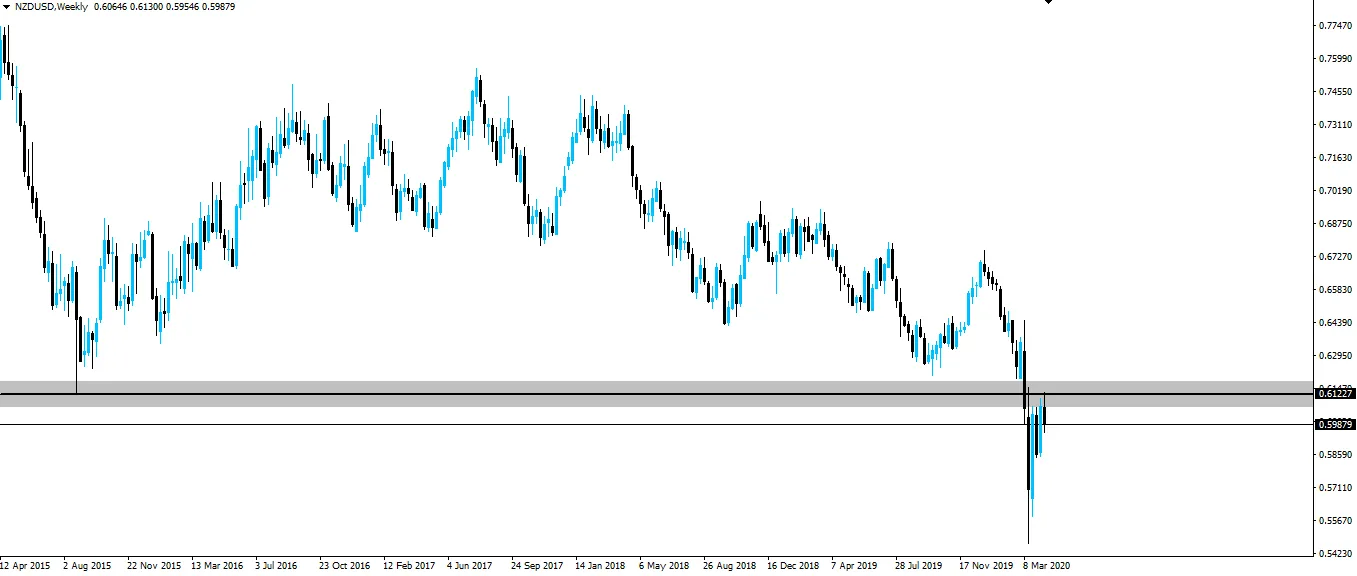
I don't normally bother this far out, but in this case, it's needed to show the 2015 swing low.
This is probably the most significant price zone in the entire history of the pair, with another V-shaped bounce off the level as far back as 2005.
So yep, it's important.
Now zoom into a daily chart and we can see that this zone is now once again in play.
NZD/USD Daily:
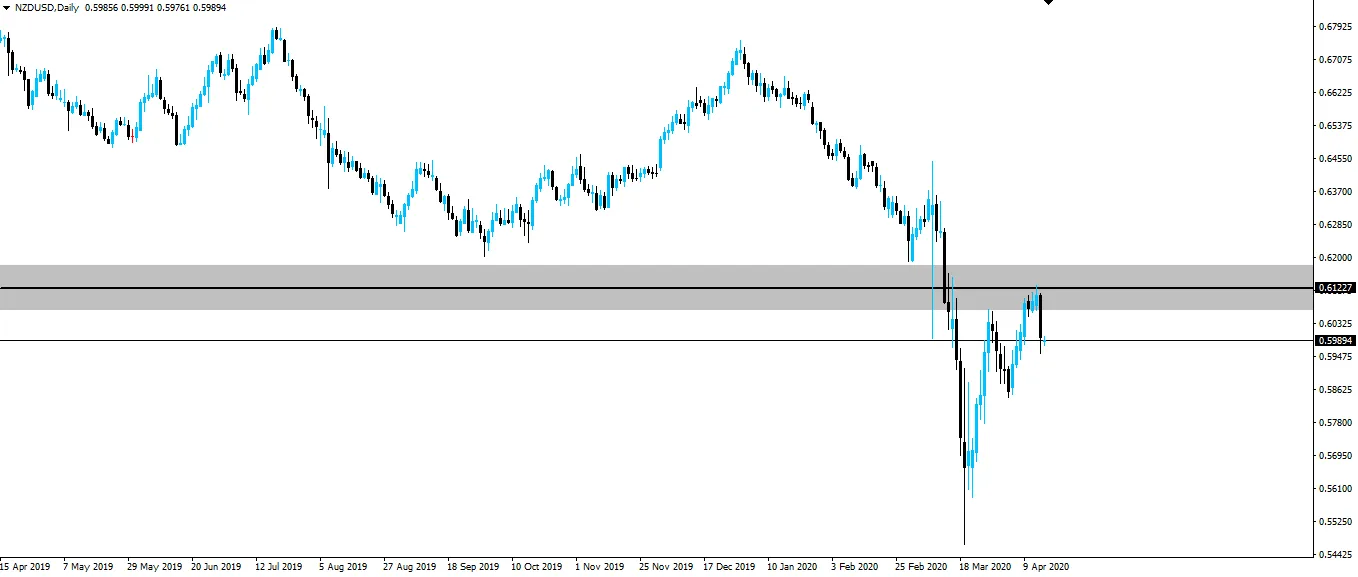
You can see that price used the zone as a key support break during the coronavirus inspired, panic drop.
While it's now acting as resistance on a re-test, cleanly holding for yesterday's nice rejection.
It's after this type of higher time frame zone holds, that we can then zoom into an intraday chart to look for targeted entries.
In this case, we want to be trading from the short side, selling intraday retests of short term support turned resistance.
Keep doing that same thing over and over!
Best of probabilities to you,
Dane.
FOREX BROKR | Hive Blog Higher time frame market analysis.
Return from NZD/USD Rejects Most Significant Zone in Pair's History to forexbrokr's Web3 Blog
