

Direct from the desk of Dane Williams.
Yikes, what a session for the SPX.
We saw the index close in negative territory for its biggest negative reversal since 2008.
The market was up 3.5% and reversed to close just down on the day.
On the chart, what the above describes is a textbook definition of a shooting star candle.
SPX Daily:
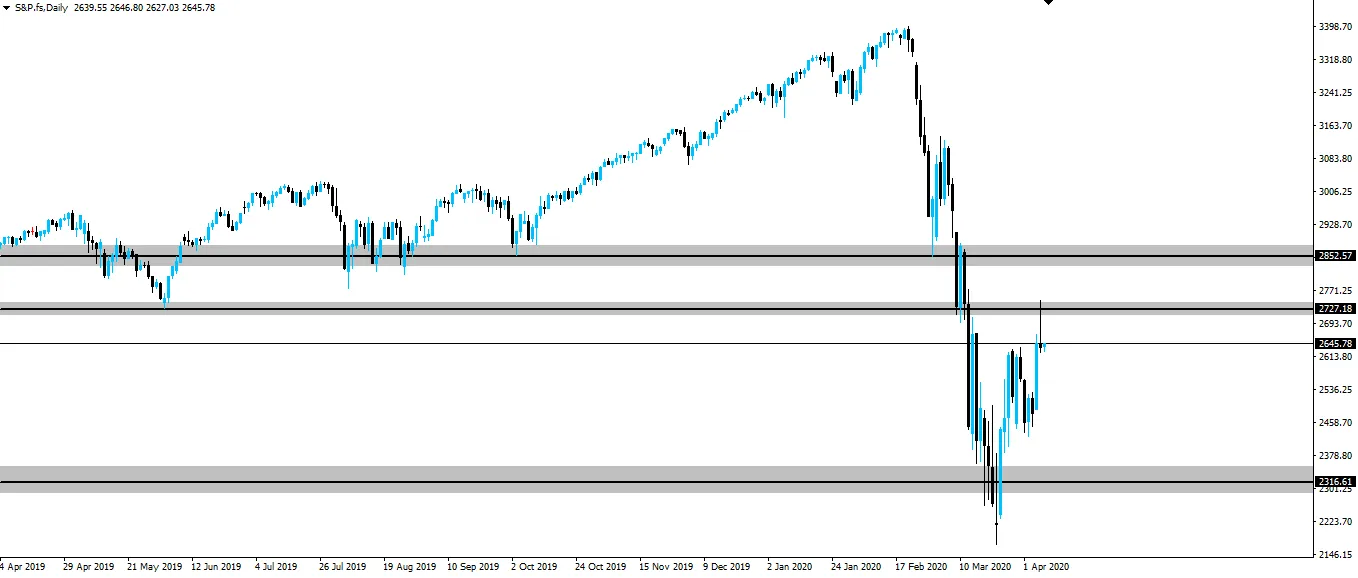
And can you see where the high of the candle spiked up into?
Straight into resistance that was previously acting as support.
What you're seeing here, is a ton of sell orders just sitting in that zone. A mix between buyers from the previous Trump-era-rally looking to get out at break-even and fresh sellers reloading at a zone with obvious sell order accumulations.
We've been watching these SPX resistance zones for a while now and with the first zone holding like that, it's most likely time to reload shorts.
To optimise your entries, zoom into an hourly chart and look to sell into previous short term support turned resistance.
Best of probabilities to you,
Dane.
FOREX BROKR | Hive Blog Higher time frame market analysis.
Return from SPX Forms Daily Shooting Star into Resistance Zone to forexbrokr's Web3 Blog
