

Direct from the desk of Dane Williams.
As the Fed continues to provide liquidity, whether there's good news (lol, remember what that felt like?) or bad, we just see the SPX continuing to grind higher day after day.
With markets closed for the weekend, it's a good time to take a step back and have a look at the higher time frame, SPX chart. Here's the daily chart below.
SPX Daily:
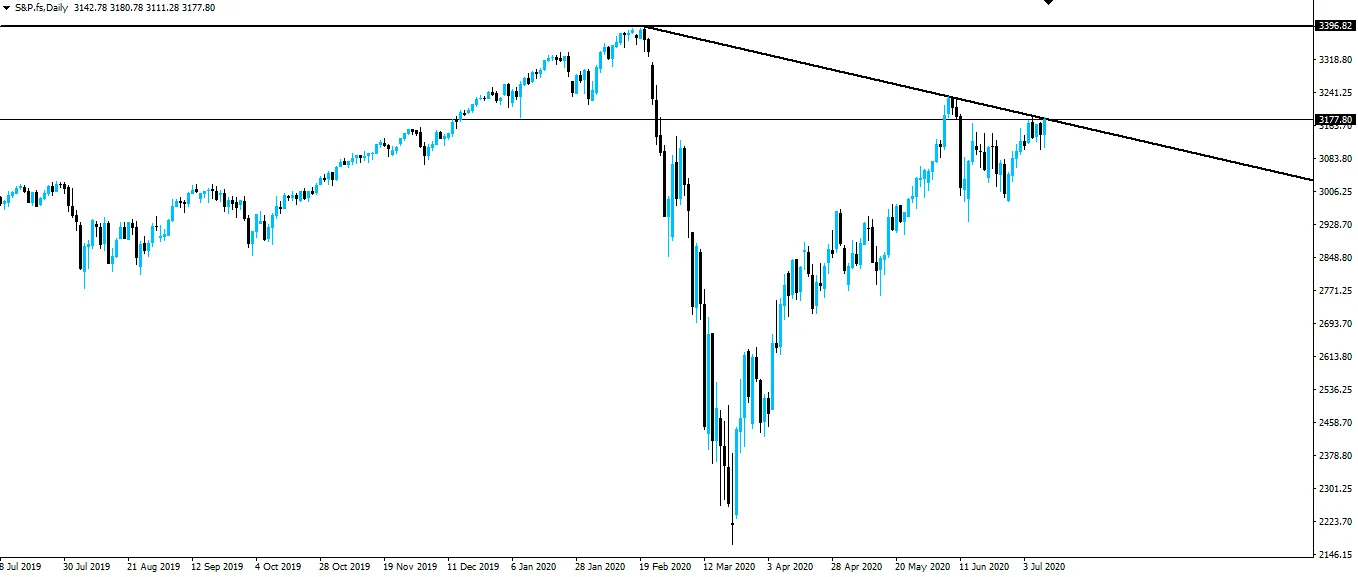
While trend lines like this are subjective and somewhat useless as the second touch didn't really see a strong rejection, it's something that shouldn't totally be ignored either.
My whole trading strategy relies on using higher time frame support/resistance zones to determine which direction I want to trade in and then zooming in to find intraday zones to manage risk around.
This trend line is a higher time frame level to be used as a guide only. Let's wait and see what price gives us if it holds or breaks.
Best of probabilities to you,
Dane.
FOREX BROKR | Hive Blog Higher time frame market analysis.
Posted Using LeoFinance
Return from SPX Pushing Daily Trend Line Resistance to forexbrokr's Web3 Blog
