

Hey guys,
So this was my morning, how was yours?

Ironically, while enjoying the natural landscape that our beautiful beaches have to offer, it was the oil market that caught my fancy.
Take a look at the daily chart for what I’m referring to:
CL Daily
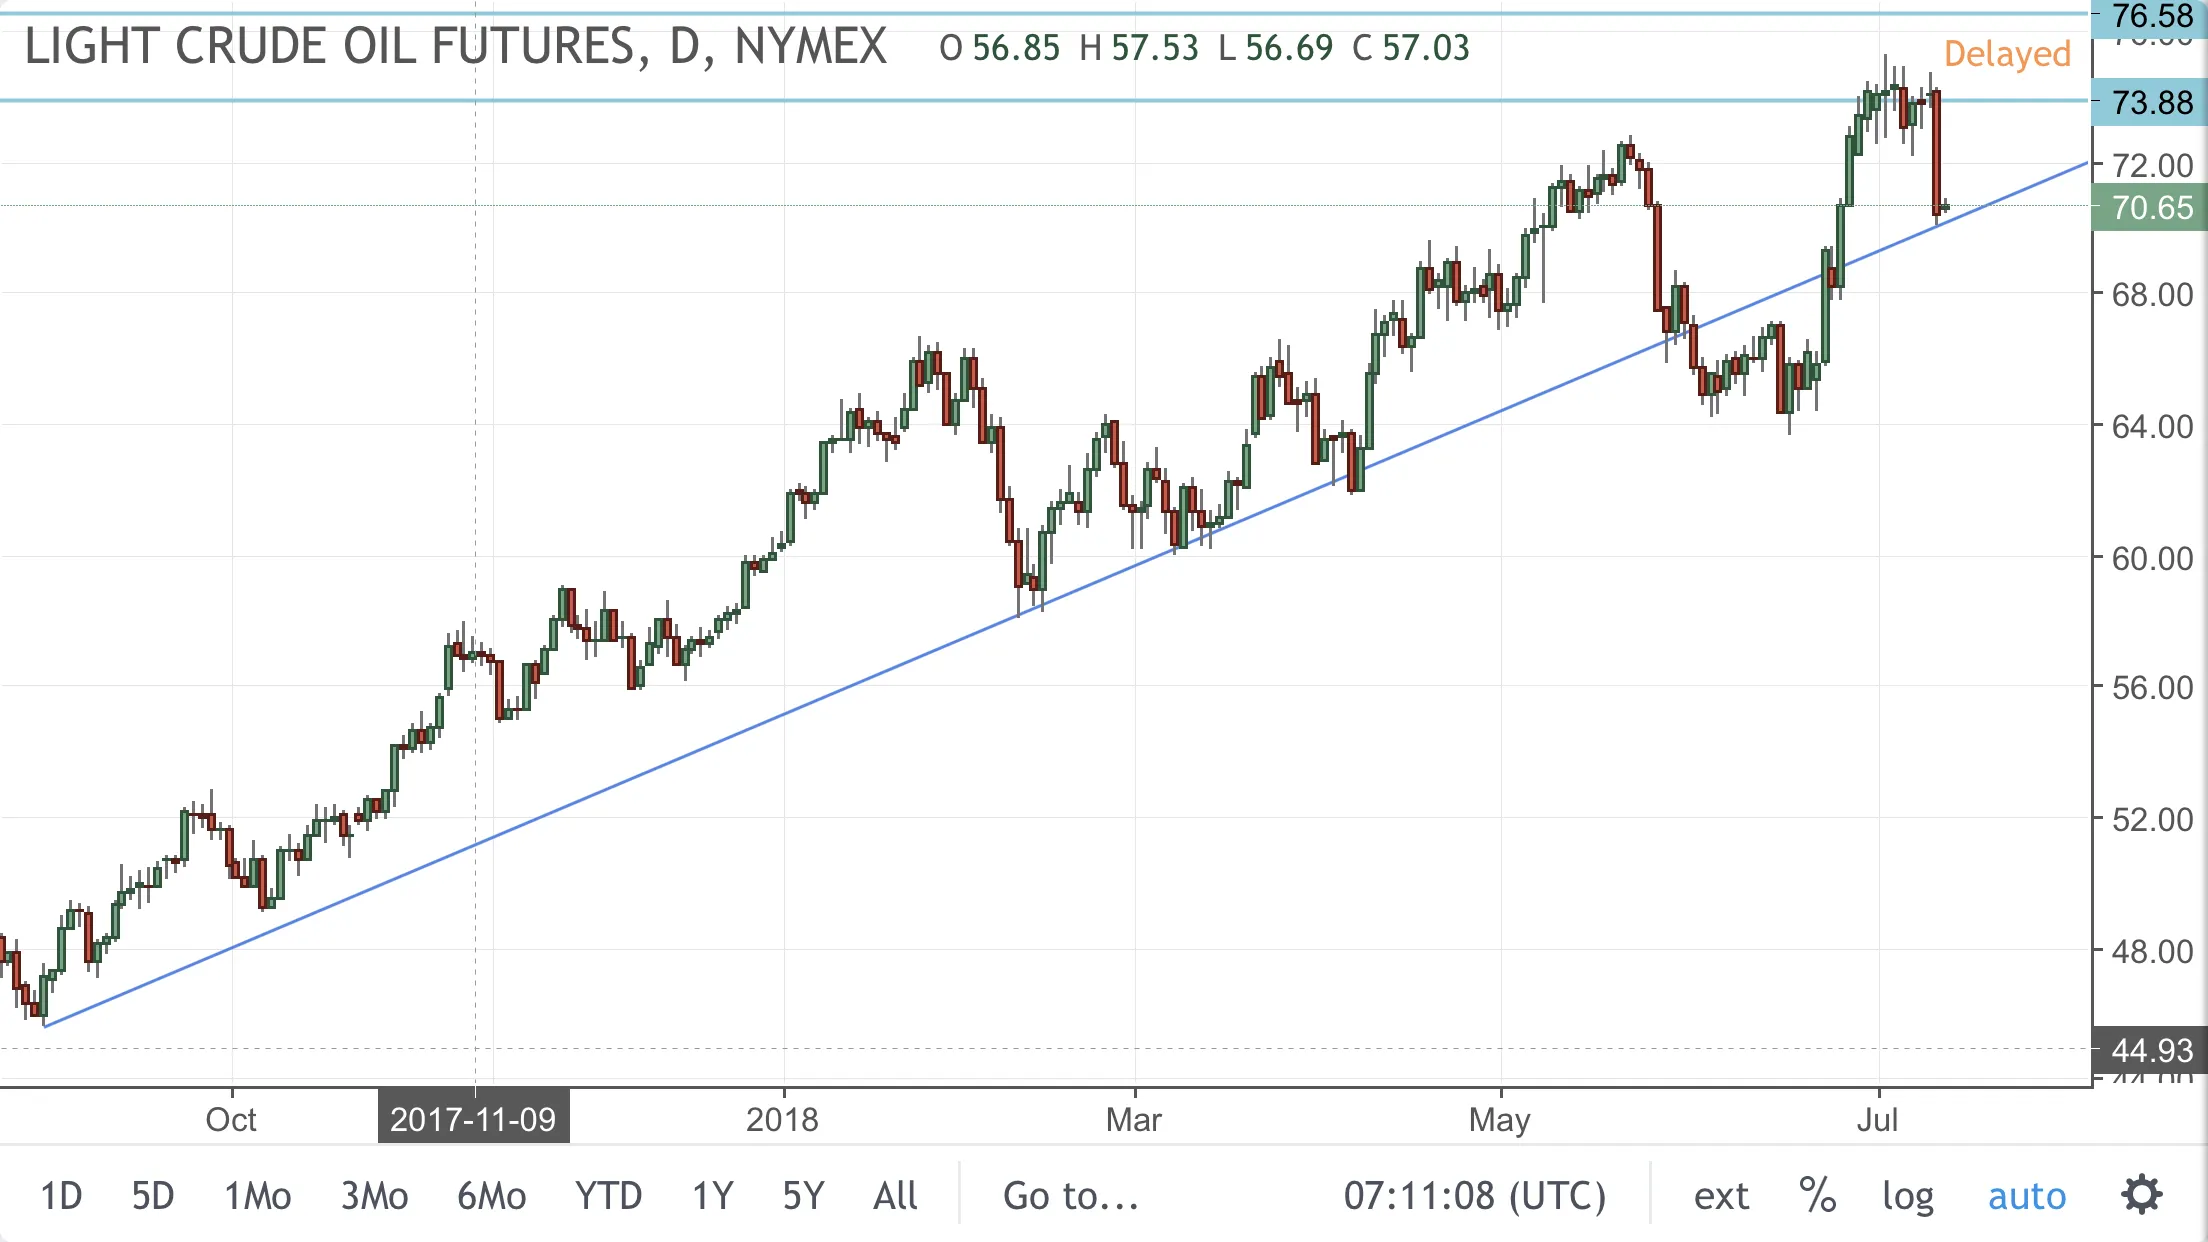
Cast your eyes to the left of the chart. Do you see the first two touches where I’ve drawn the trend line?
Now this line has been on my chart for a while, but now take a look to the right.
BAM!
How about that reactivation of the line as support. To the absolute pip.
Technicals are funnnn.
✌🏻.
@forexbrokr | Steemit Blog
Market Analyst and Forex Broker.

Twitter: @forexbrokr Instagram: @forexbrokr
Leave a comment to chat about forex and crypto trading mentorship.
Return from The Irony of Looking at an Oil Chart at the Beach to forexbrokr's Web3 Blog
