

Direct from the desk of Dane Williams.
After clearing our USD/CAD charts around two weeks ago, the pair has since broken out of the descending channel and dropped 500 pips.
I talked about a V-shaped recovery in the Aussie, but this is V-shaped destruction!
Take a look at the daily chart for a higher time frame look at the price action I'm talking about.
USD/CAD Daily:
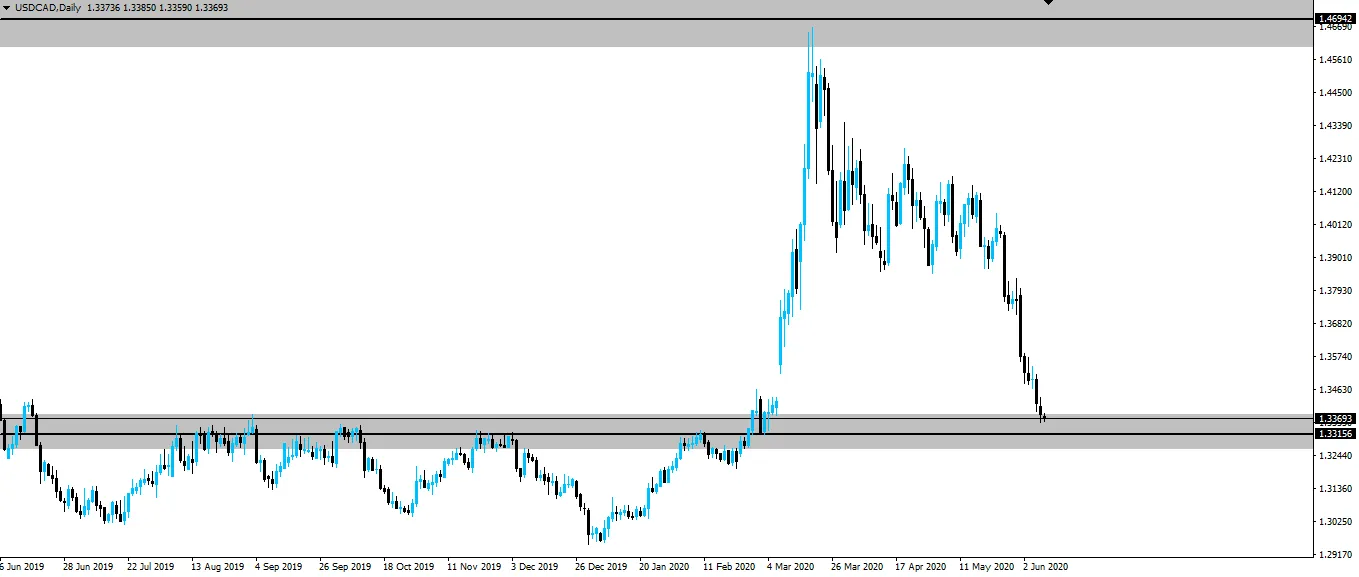
But most importantly take a look at the daily zone that price has pulled back into.
You can see on the daily when you look to the left that this was sort of the last swing high resistance zone before price broke out and went parabolic when Corona first hit.
Now that price has pulled back to retest the zone as support, we can use it as the higher time frame zone to ensure we're trading on the right side of the market.
If the daily zone holds as support, then we're a buyer. If it doesn't then we're a seller. Simple.
Let's see how this one plays out from here.
Best of probabilities to you,
Dane.
FOREX BROKR | Hive Blog Higher time frame market analysis.
Posted Using LeoFinance
Return from USD/CAD New Daily Zone In-Play to forexbrokr's Web3 Blog
