

USD/JPY Technical Analysis
Morning team,
While we've had the opportunity to short USD/JPY for months now as the bearish trend has just been relentless on the pair but with other correlated pairs giving cleaner setups, my attention has been elsewhere.
But as one of the big majors, I have however been following USD/JPY on my MT4 watchlist and therefore keeping my major support/resistance levels up to date on the charts. Check out the following excerpt from last week's weekend market preview where I have continued to feature the pair:
- Higher time frame bearish trend.
- Below higher time frame support/resistance.
This one looks a bit like the Aussie, except with price being hammered by USD weakness. Right out of trend line resistance by the way. Check it out on the hourly for a clean looking technical move.
That all sounds pretty bearish to me.
Now lets take a look at an updated USD/JPY daily chart so I can show you exactly what I'm talking about.
USD/JPY Daily:

- Higher time frame bearish trend still in tact - ✅
That ones pretty obvious. My highly scientific method of seeing that the chart runs from the top left hand corner to the bottom right hand corner of my screen, works well. (See, you really can make trading as simple or as hard as you like).
- Price still below higher time frame support/resistance - ✅
I'm using the horizontal zone that I've marked on the chart. It was respected as support, broken, and then respected this time as resistance. It's highly significant.
So yep, we're still looking very bearish.
Now I want you to also just zoom in one more time to a USD/JPY 4 hourly chart so I can show you one more thing:
USD/JPY 4 Hourly:
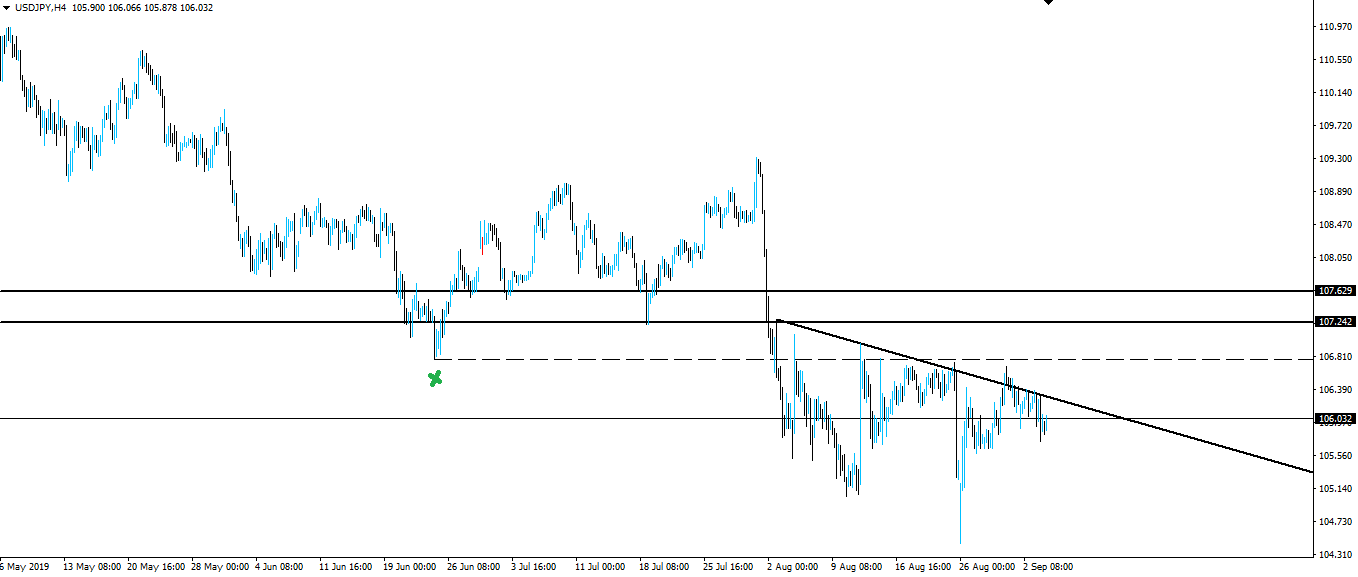
I know the MT4 charts zoomed out this far look gross, but I needed to do it in order to show you the little swing low that price is respecting.
When you add the trend line in as well, this area certainly becomes a nice confluence of resistance and is all the more reason for us to be happy looking to trade USD/JPY from the short side.
It's these intraday setups that we identify and trade inside my Inner Circle. If you want to read how I'm looking to actually trade my analysis like this USD/JPY short setup, then click the link below and get involved!
Best of probabilities to you,
Dane.
Today's Economic Releases
Wednesday: AUD GDP q/q CAD Trade Balance GBP Inflation Report Hearings CAD BOC Rate Statement CAD Overnight Rate
Return from USD/JPY Remains Capped by Confluence of Resistance to forexbrokr's Web3 Blog
