
### XAU/USD Key Points
- Higher time frame bullish trend.
- Price pulls back in a flag pattern, forming a bottom at previous resistance.
- Looking for intraday price action we can trade from the long side.
XAU/USD Technical Analysis
This isn't a chart setup that I've Tweeted from any sort of signal, but it's one of the more liquid markets that is on my MT4 watch list and I'm sure is on yours somewhere too.
So let's get into it. Here are the charts that show what I'm talking about:
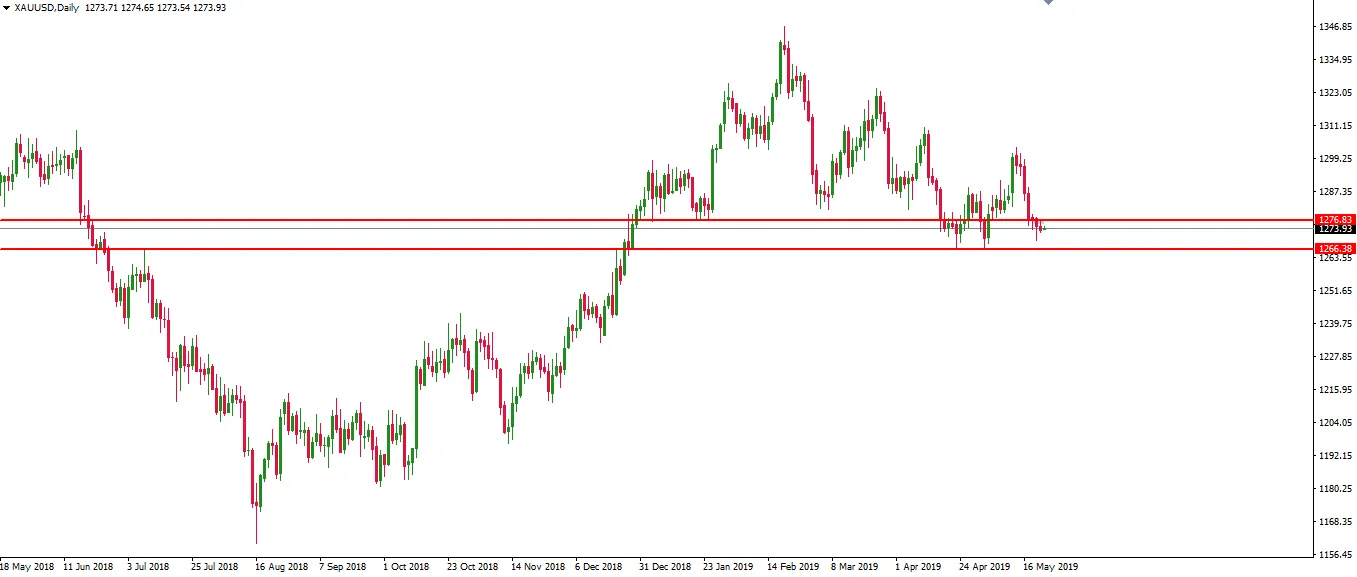
First up, the higher time frame chart. I've posted the daily chart here, simply because it clearly shows numerous touches from both sides.
After a long, consistent bullish rally, dating back to August last year, price has pulled back into this zone in question and retested it this time as support.
You can see price is definitely looking like it's bottoming, but whether it actually is or whether it's ready to bust through, we'll see.
But as long as price is above this higher time frame zone, I see managing my risk from the long side a lot clearer, so that's the direction I want to trade it.
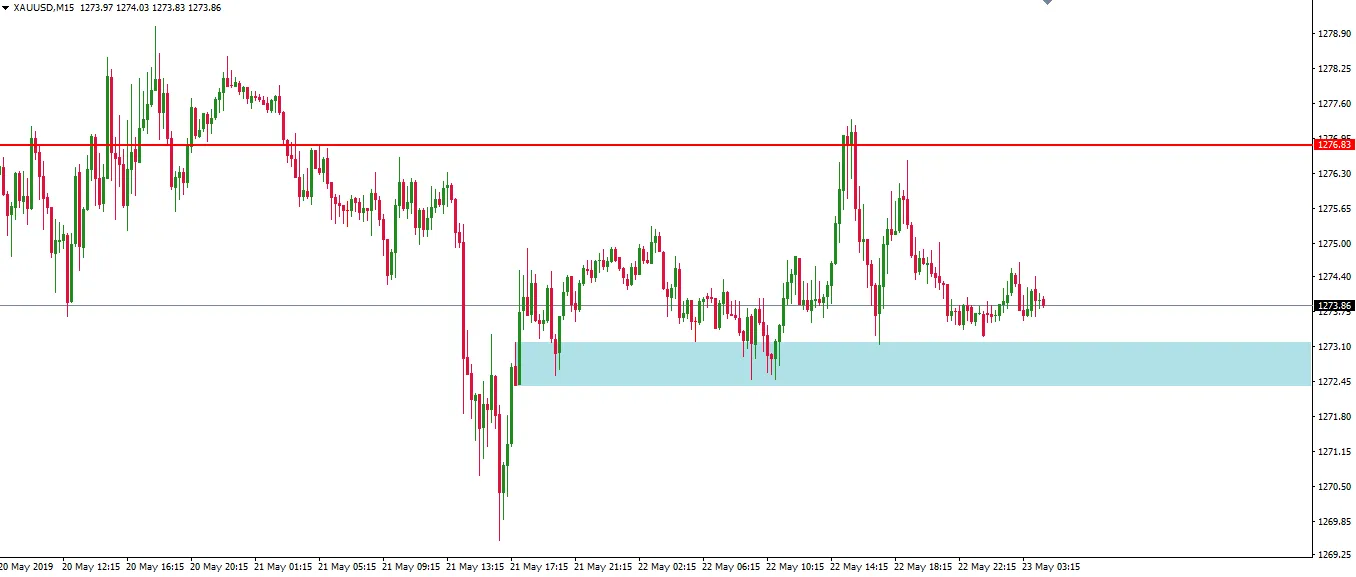
With this being my thinking, let's then take a look at an intraday chart. Second up, I've posted the 15 minute to find short term resistance that will potentially be retested as support to trade around, but you can use whichever chart you want.
We've seen a couple of bounces already and there's been a few opportunities to trade the zone.
Will we get another?
Best of probabilities to you.
Dane.
Upcoming Economic Releases
-
GBP Retail Sales m/m
-
USD Core Durable Goods Orders m/m
Return from XAU/USD Flags Back into Golden Zone to forexbrokr's Web3 Blog
